The Hudson River Estuary
Competitive analysis and visual research led to moodboards that explored visual concepts and tones. At the same time we dove into the datasets to experiment with different ways to represent HEP’s research in visualizations. The unique character of the geography and the information-based content informed the shape and feel of the reports. Iterations, feedback and many conversations with HEP and their partners were also integral to the process.
Pratt Institute’s Spatial Analysis and Visualization Initiative (SAVI) has been a partner and collaborator on this project. The final report which is focused on Water Quality is currently in progress.
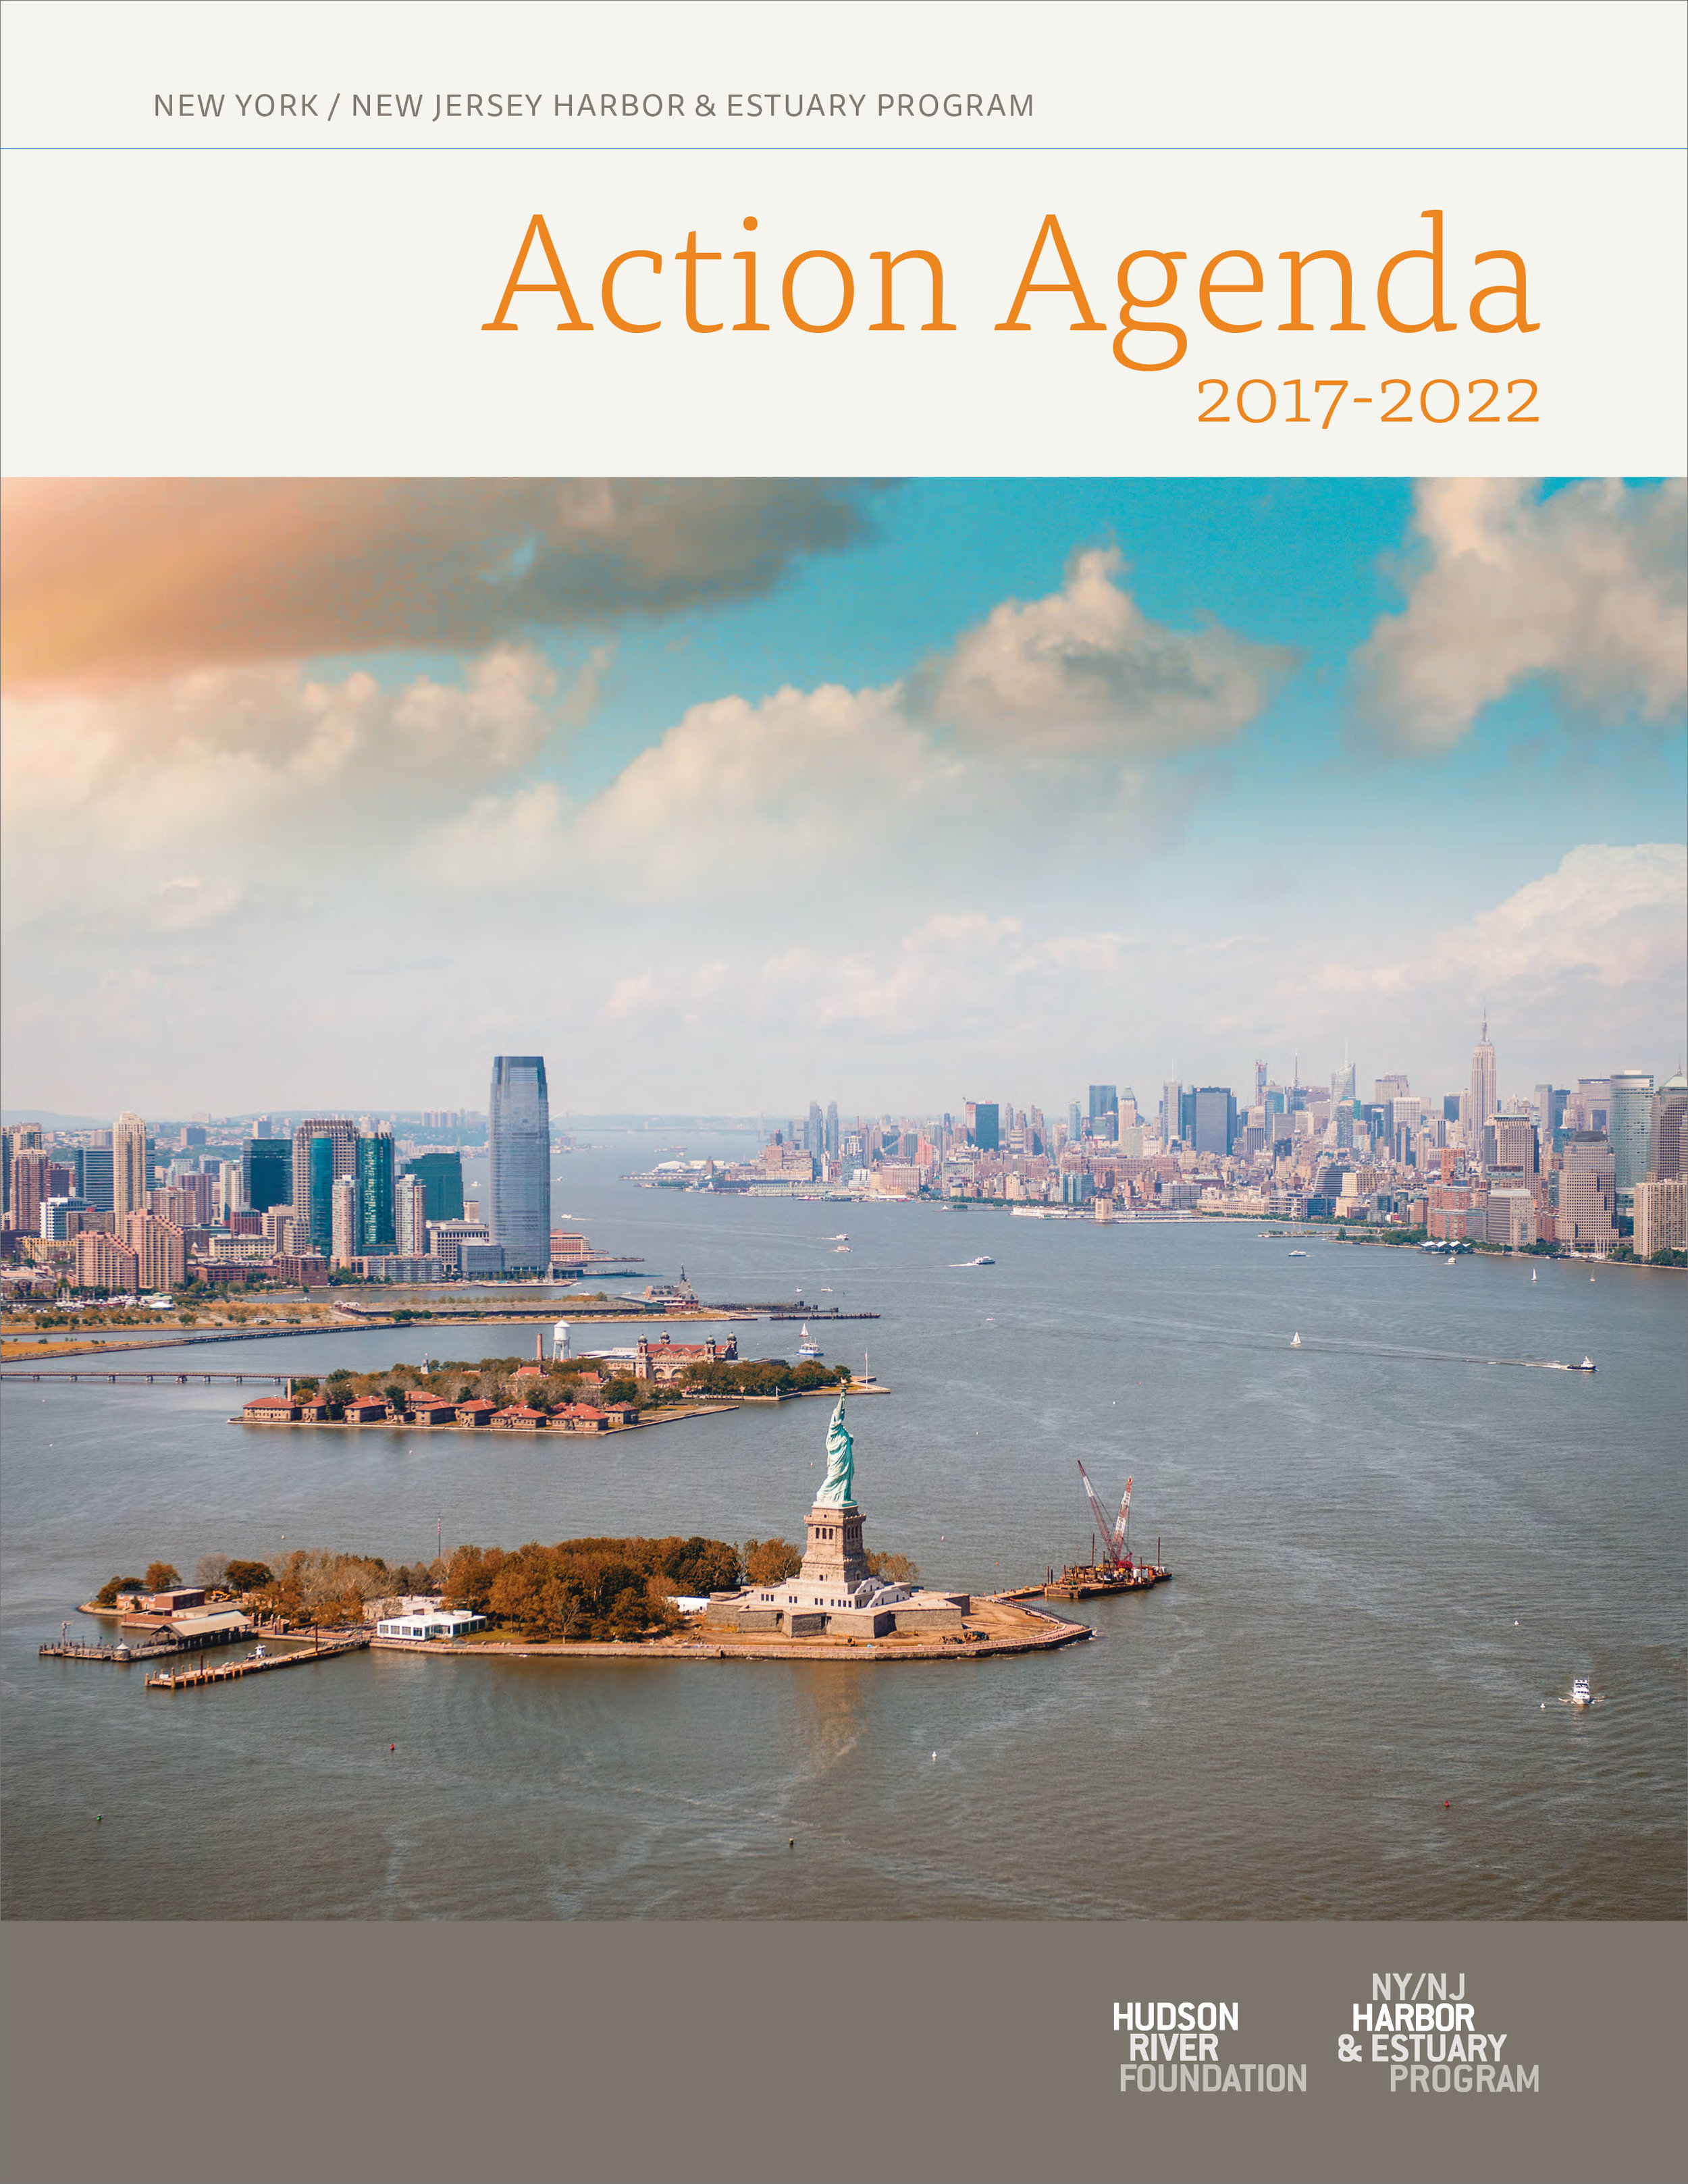
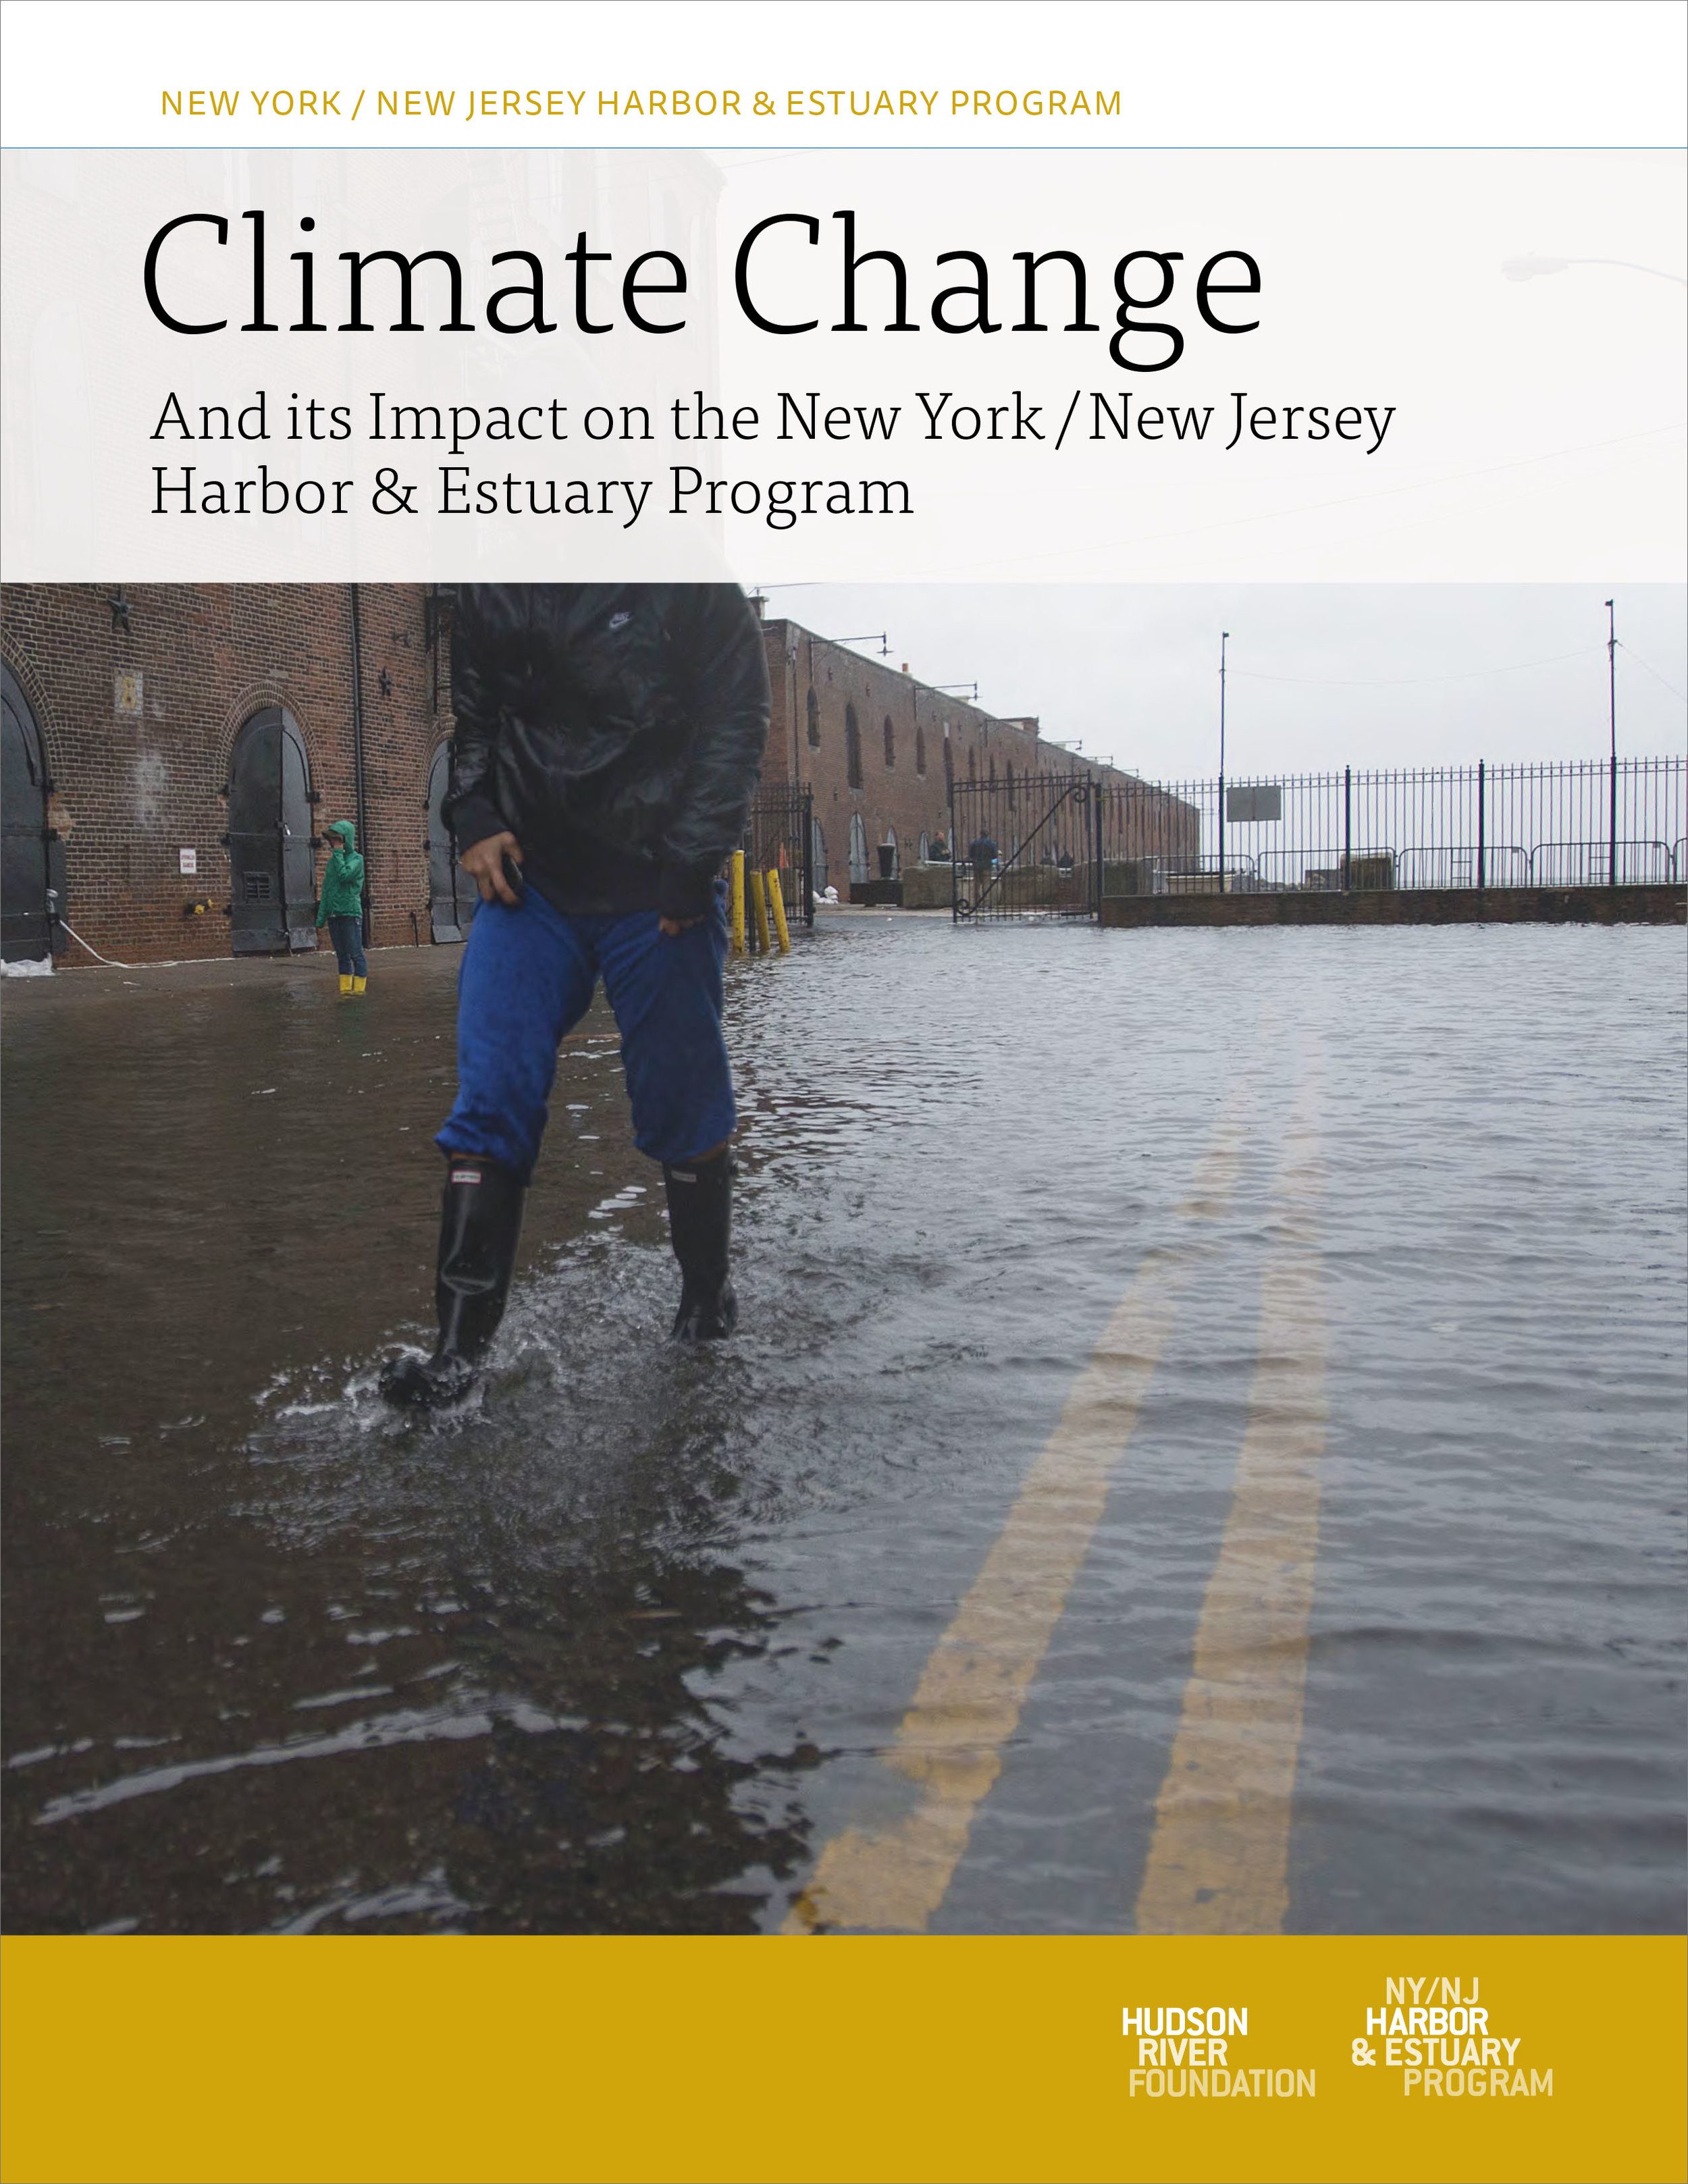
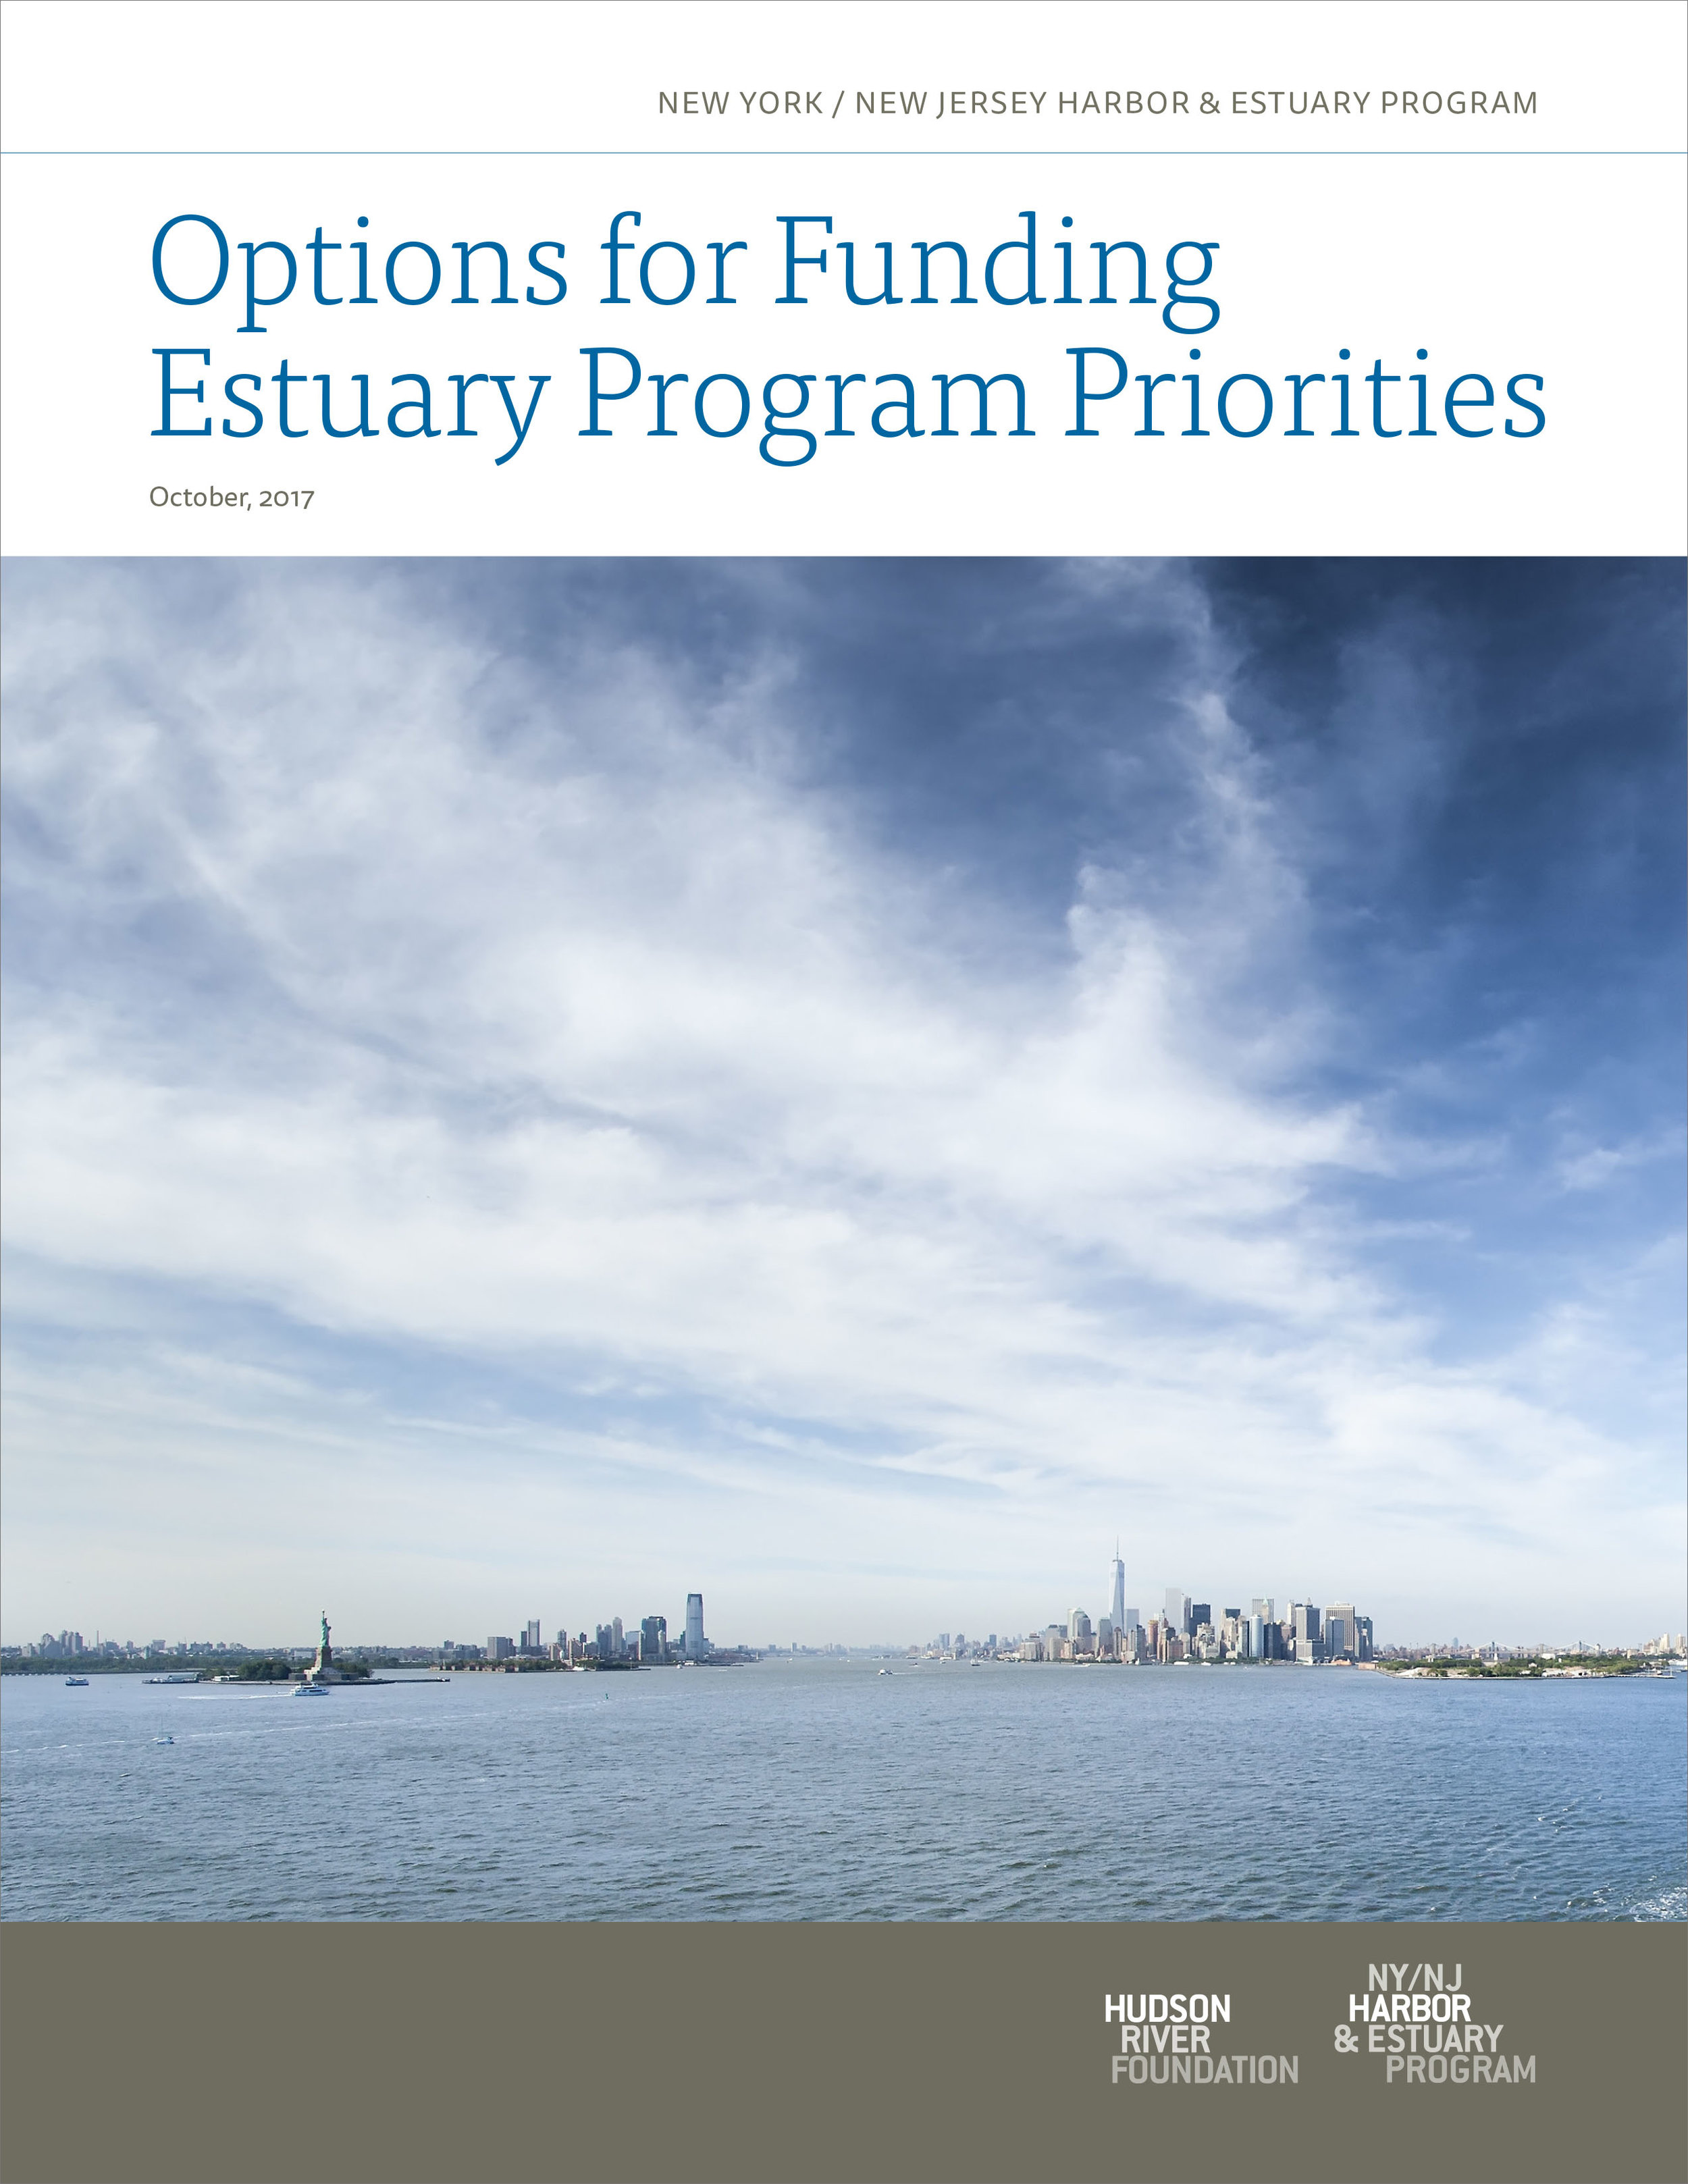
For the NY-NJ Harbor Estuary Program (HEP) I designed a visual system for a group of 5 reports distributed in print and online.
These reports are intended to reach a wide audience of general public, policy makers, educators, scientists and more; while also complying with requirements of the EPA. Our goal was to develop materials that are inviting, clear and accessible to all these groups while also communicating the nuance and challenges inherent in conservation work of the Hudson-Raritan Estuary. To reach this goal we used a design process that began by learning about the client and their work, their goals and their research.
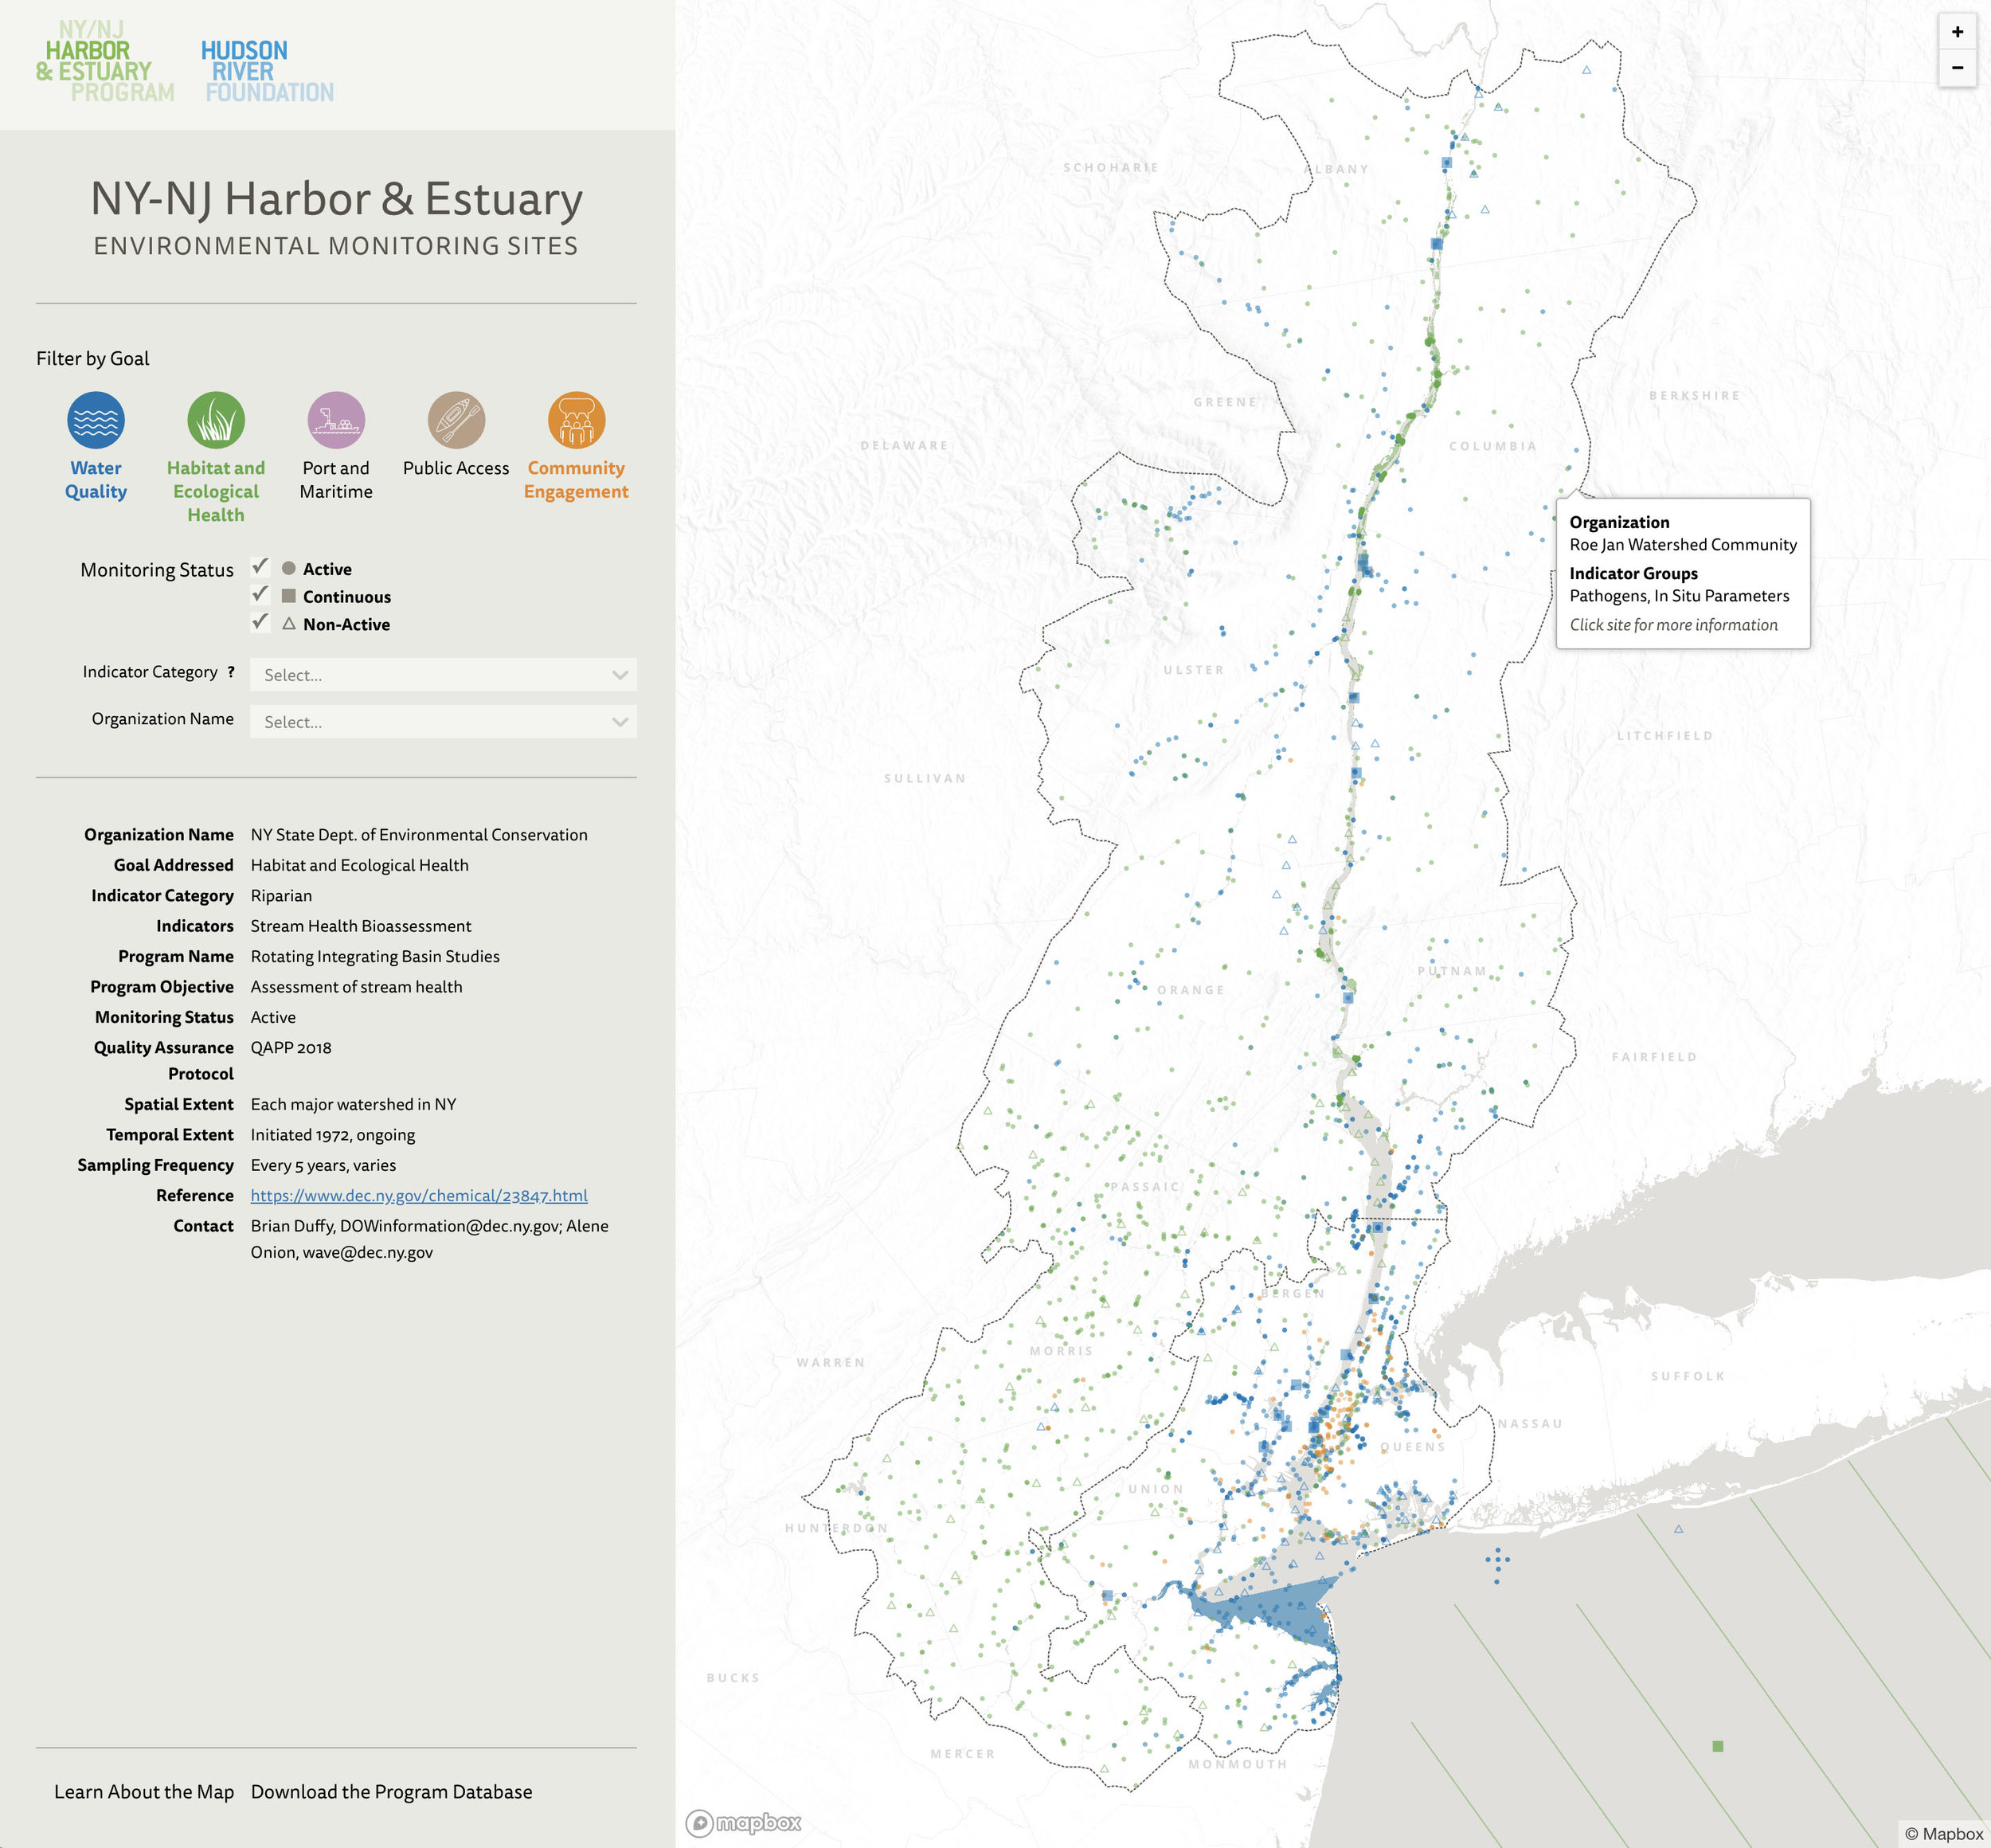
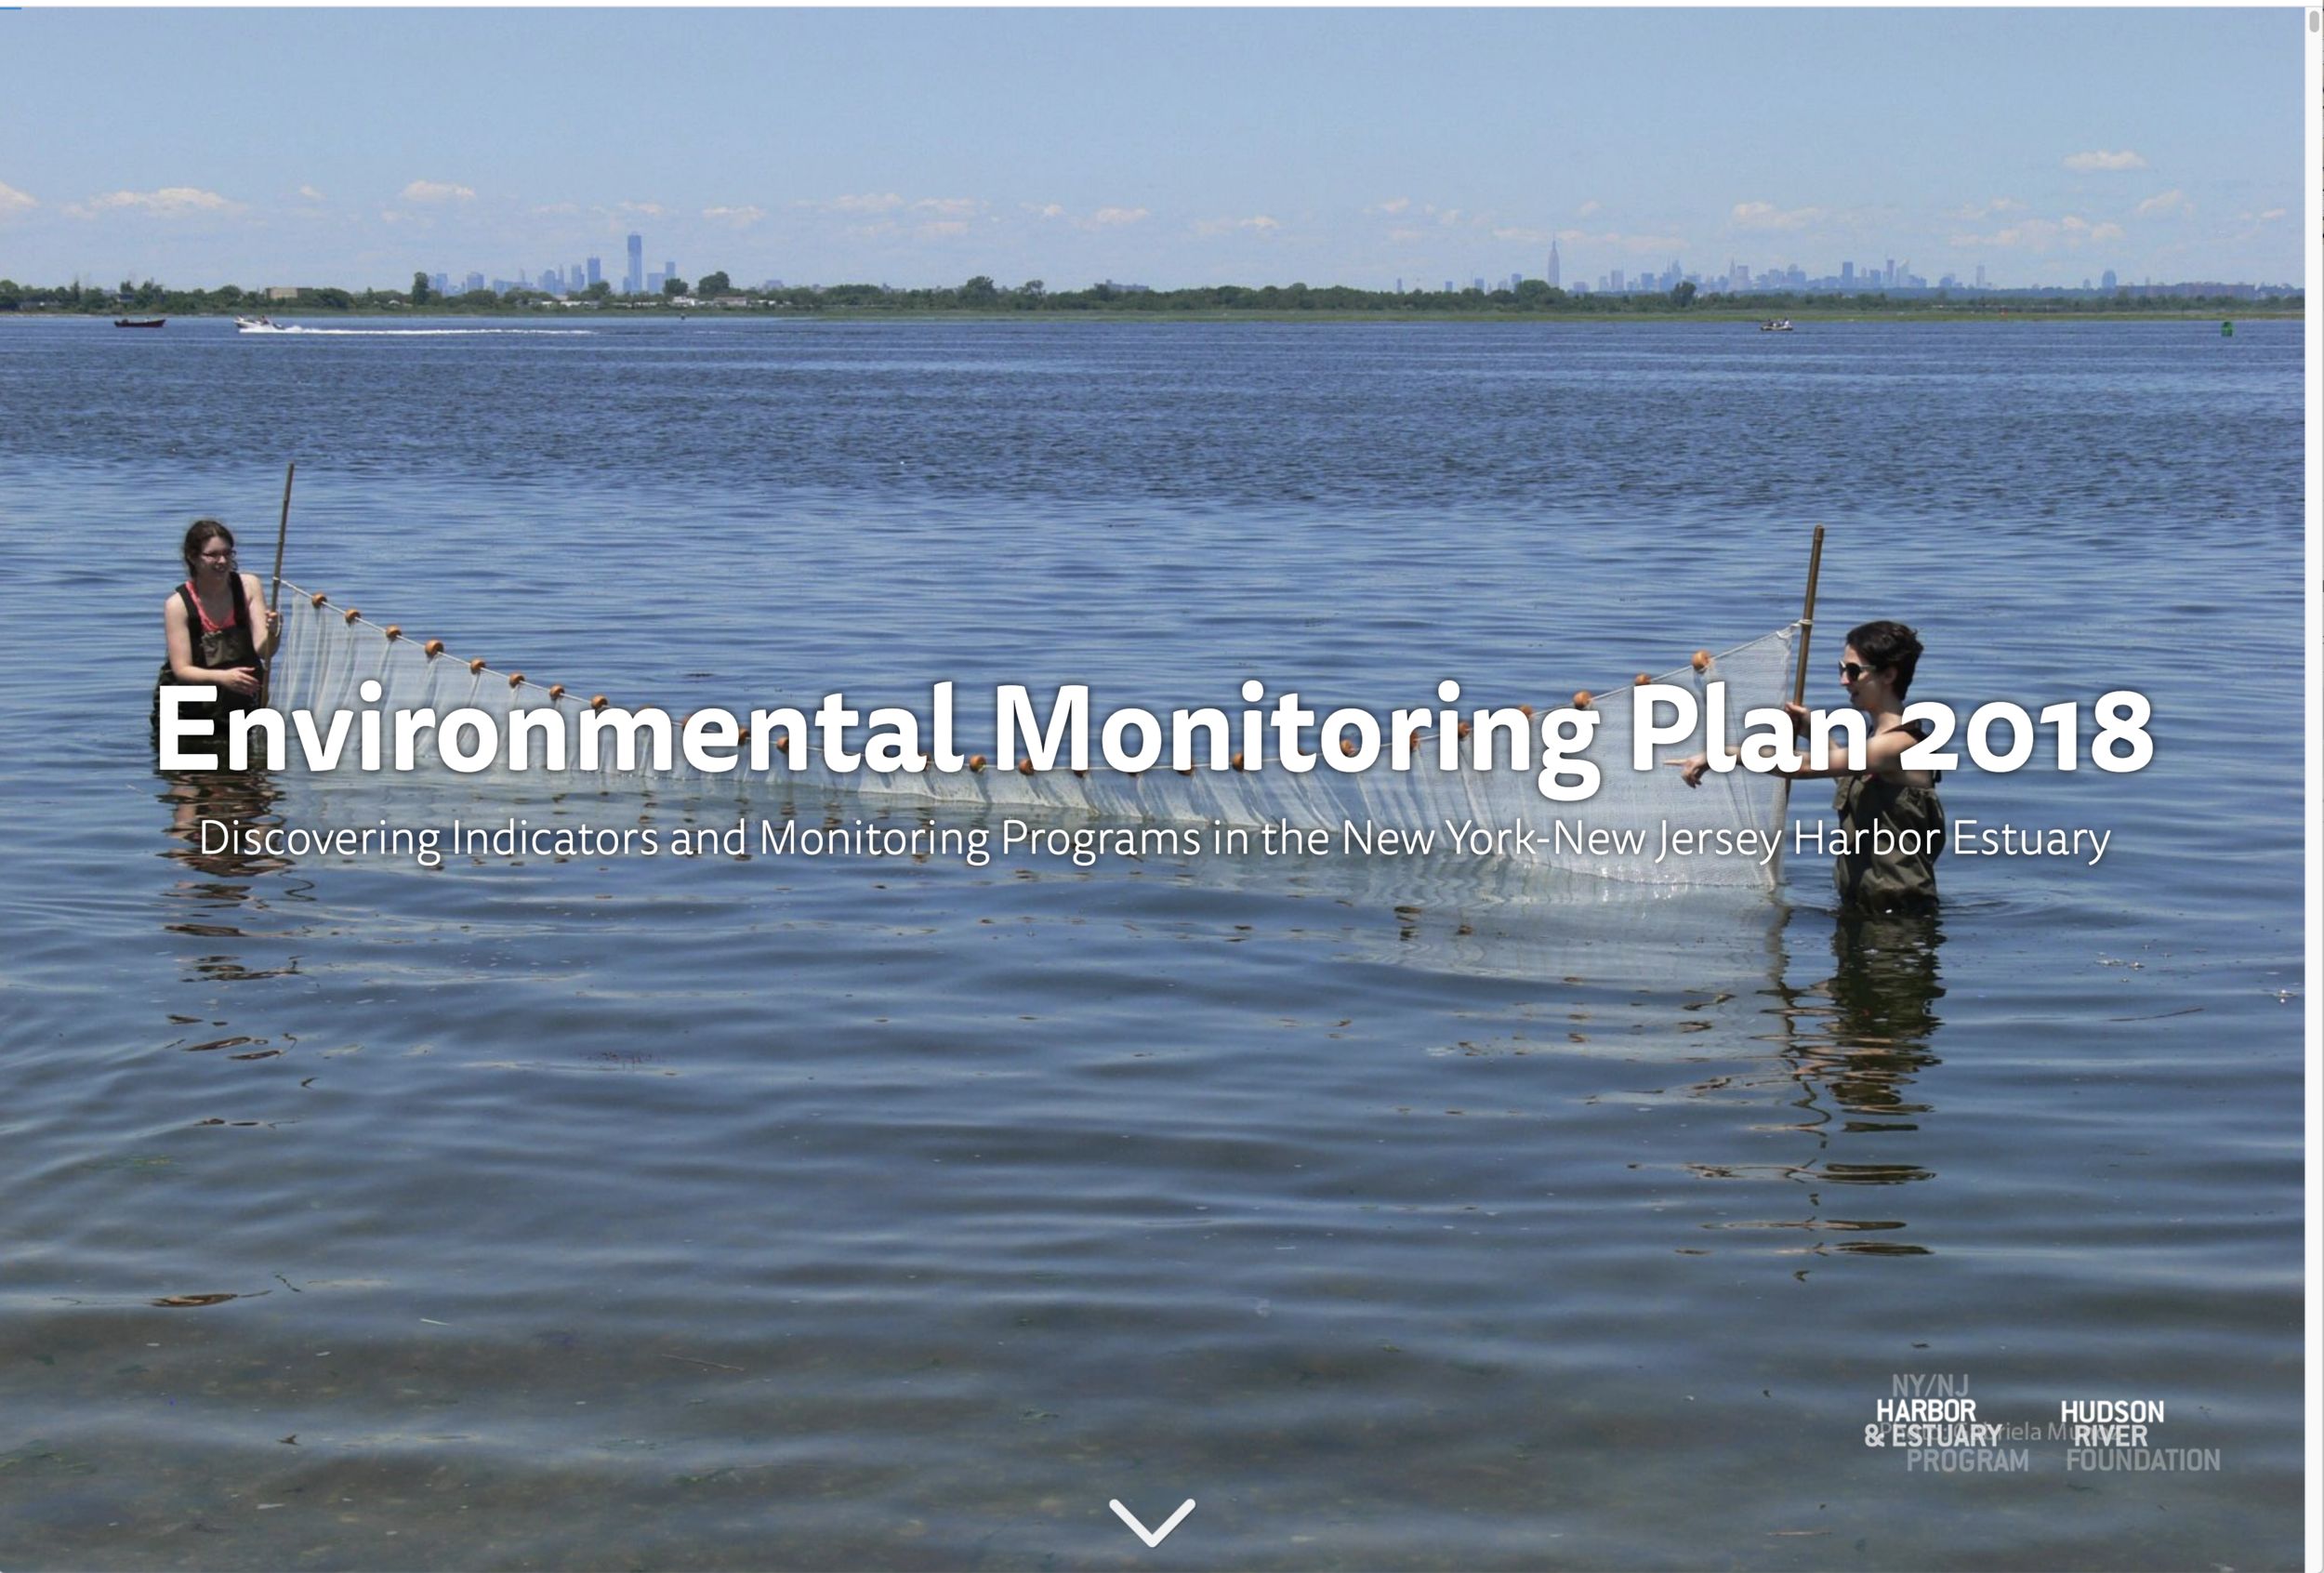
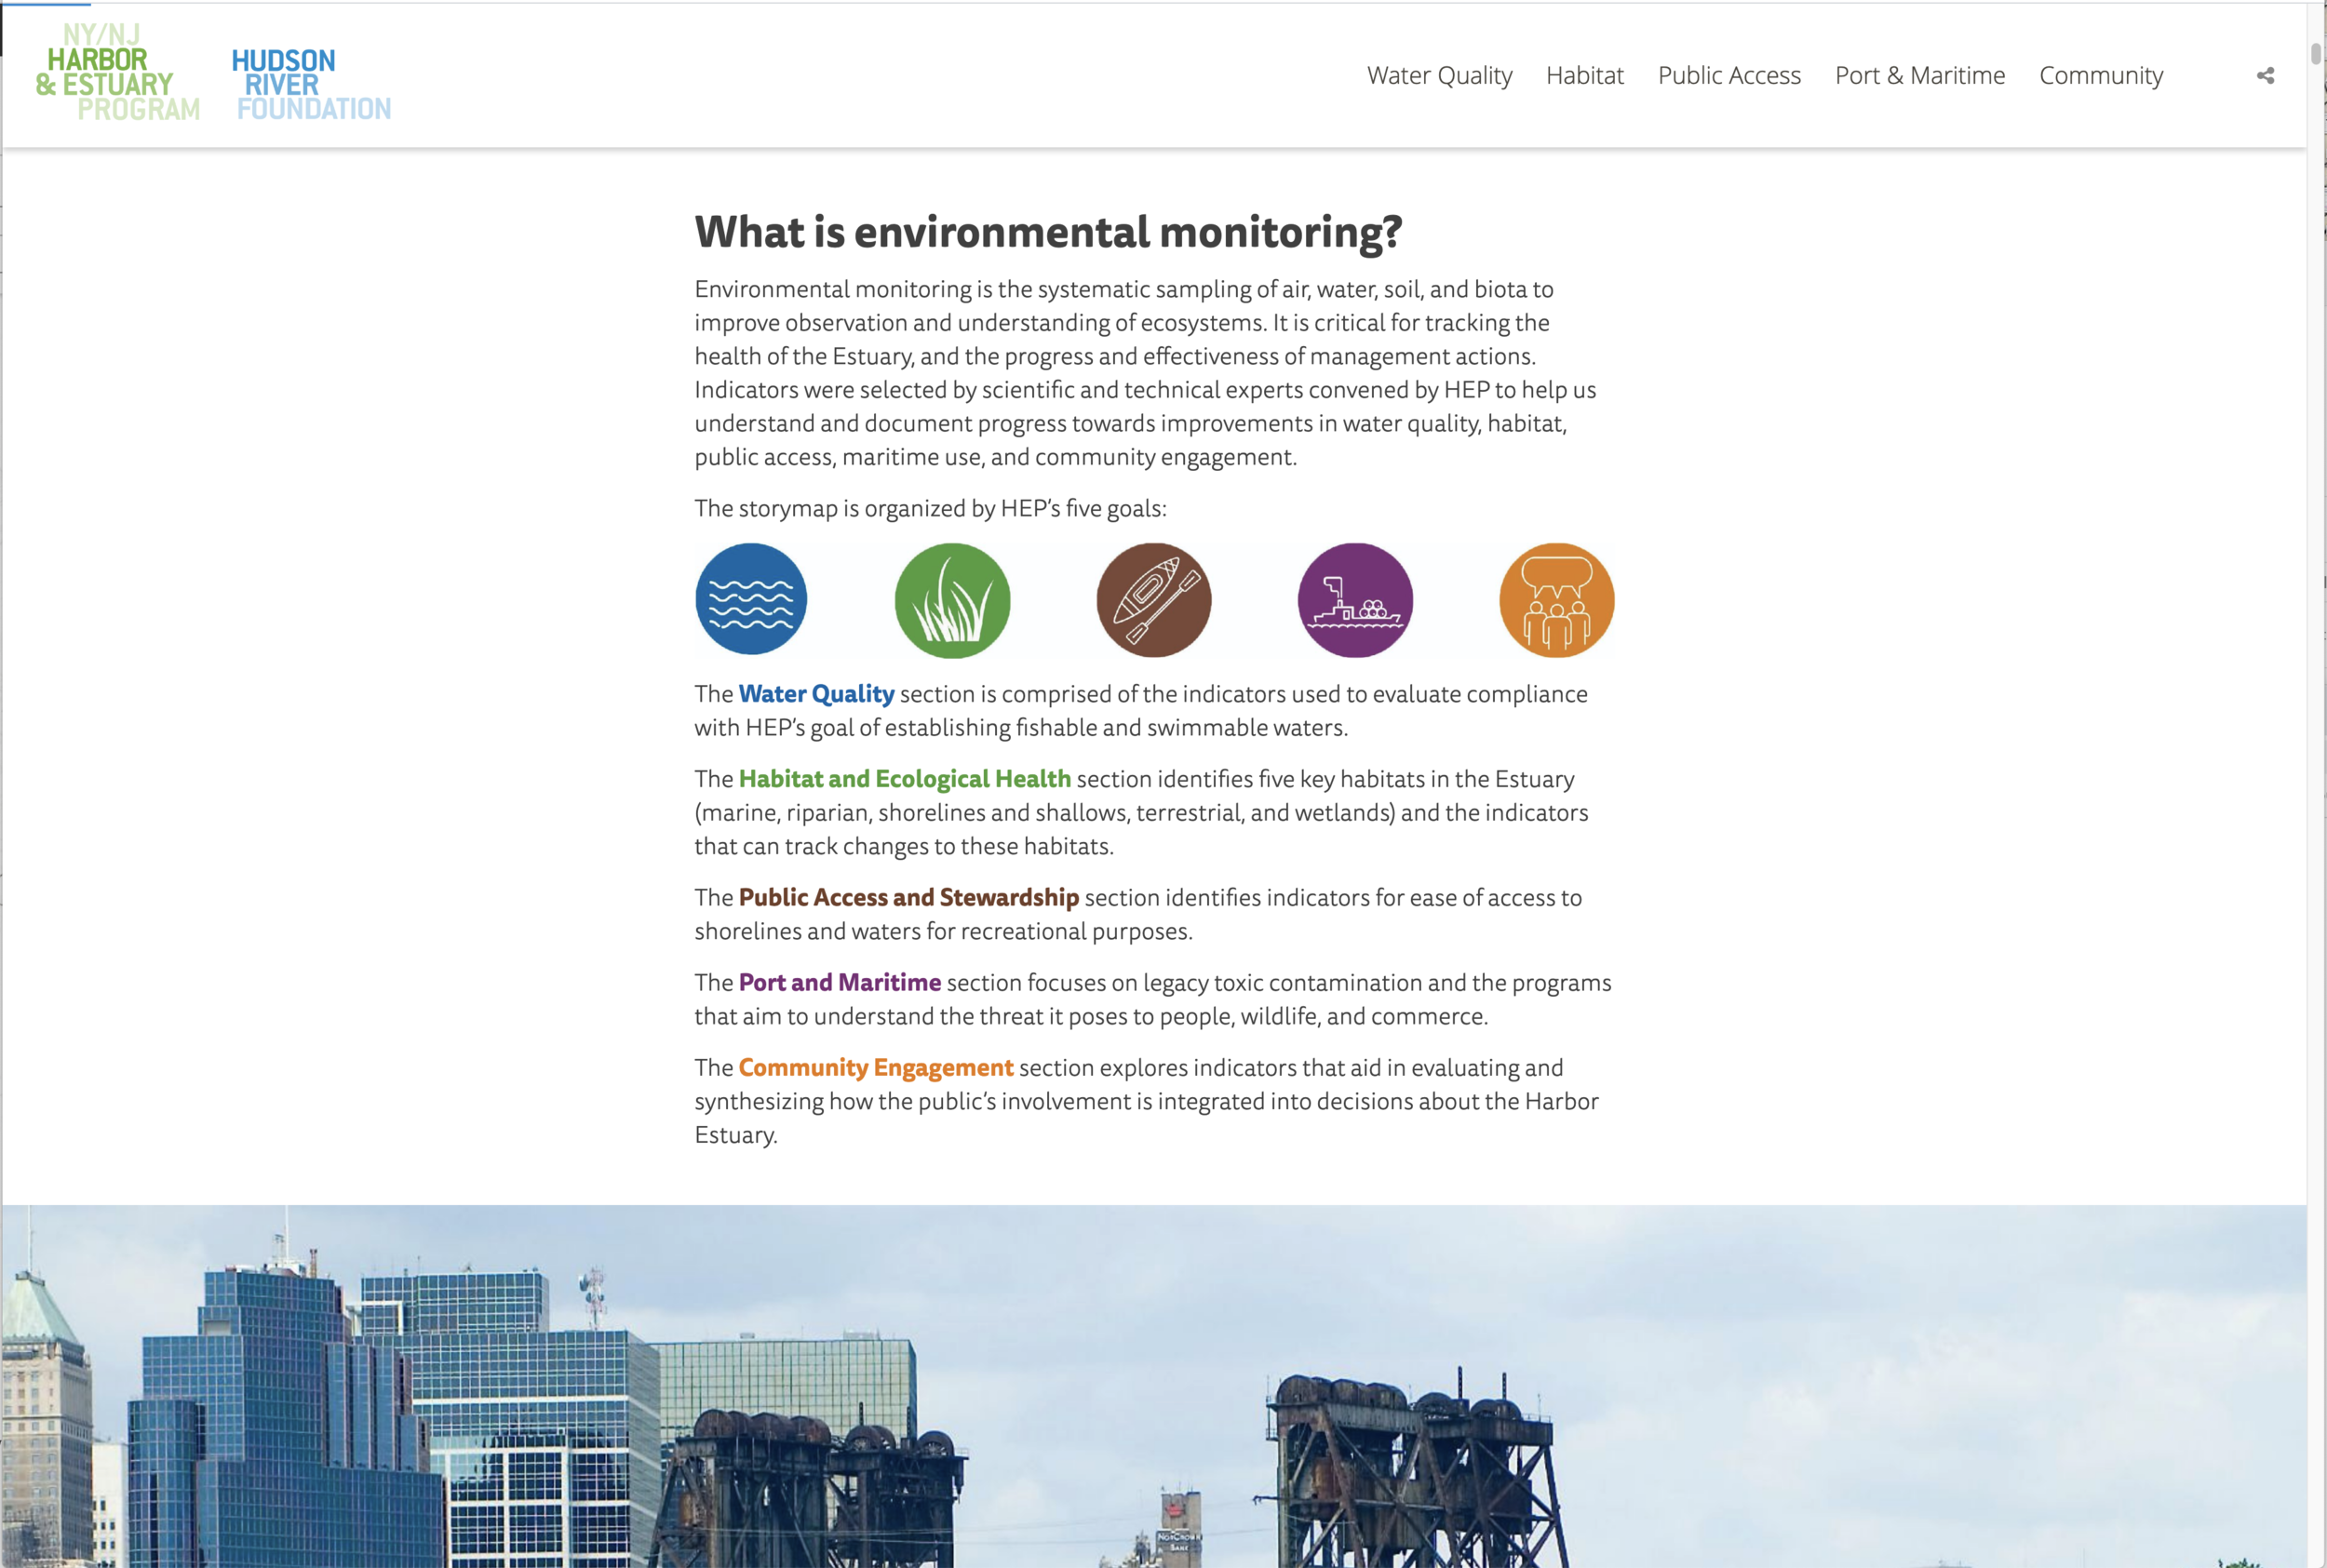
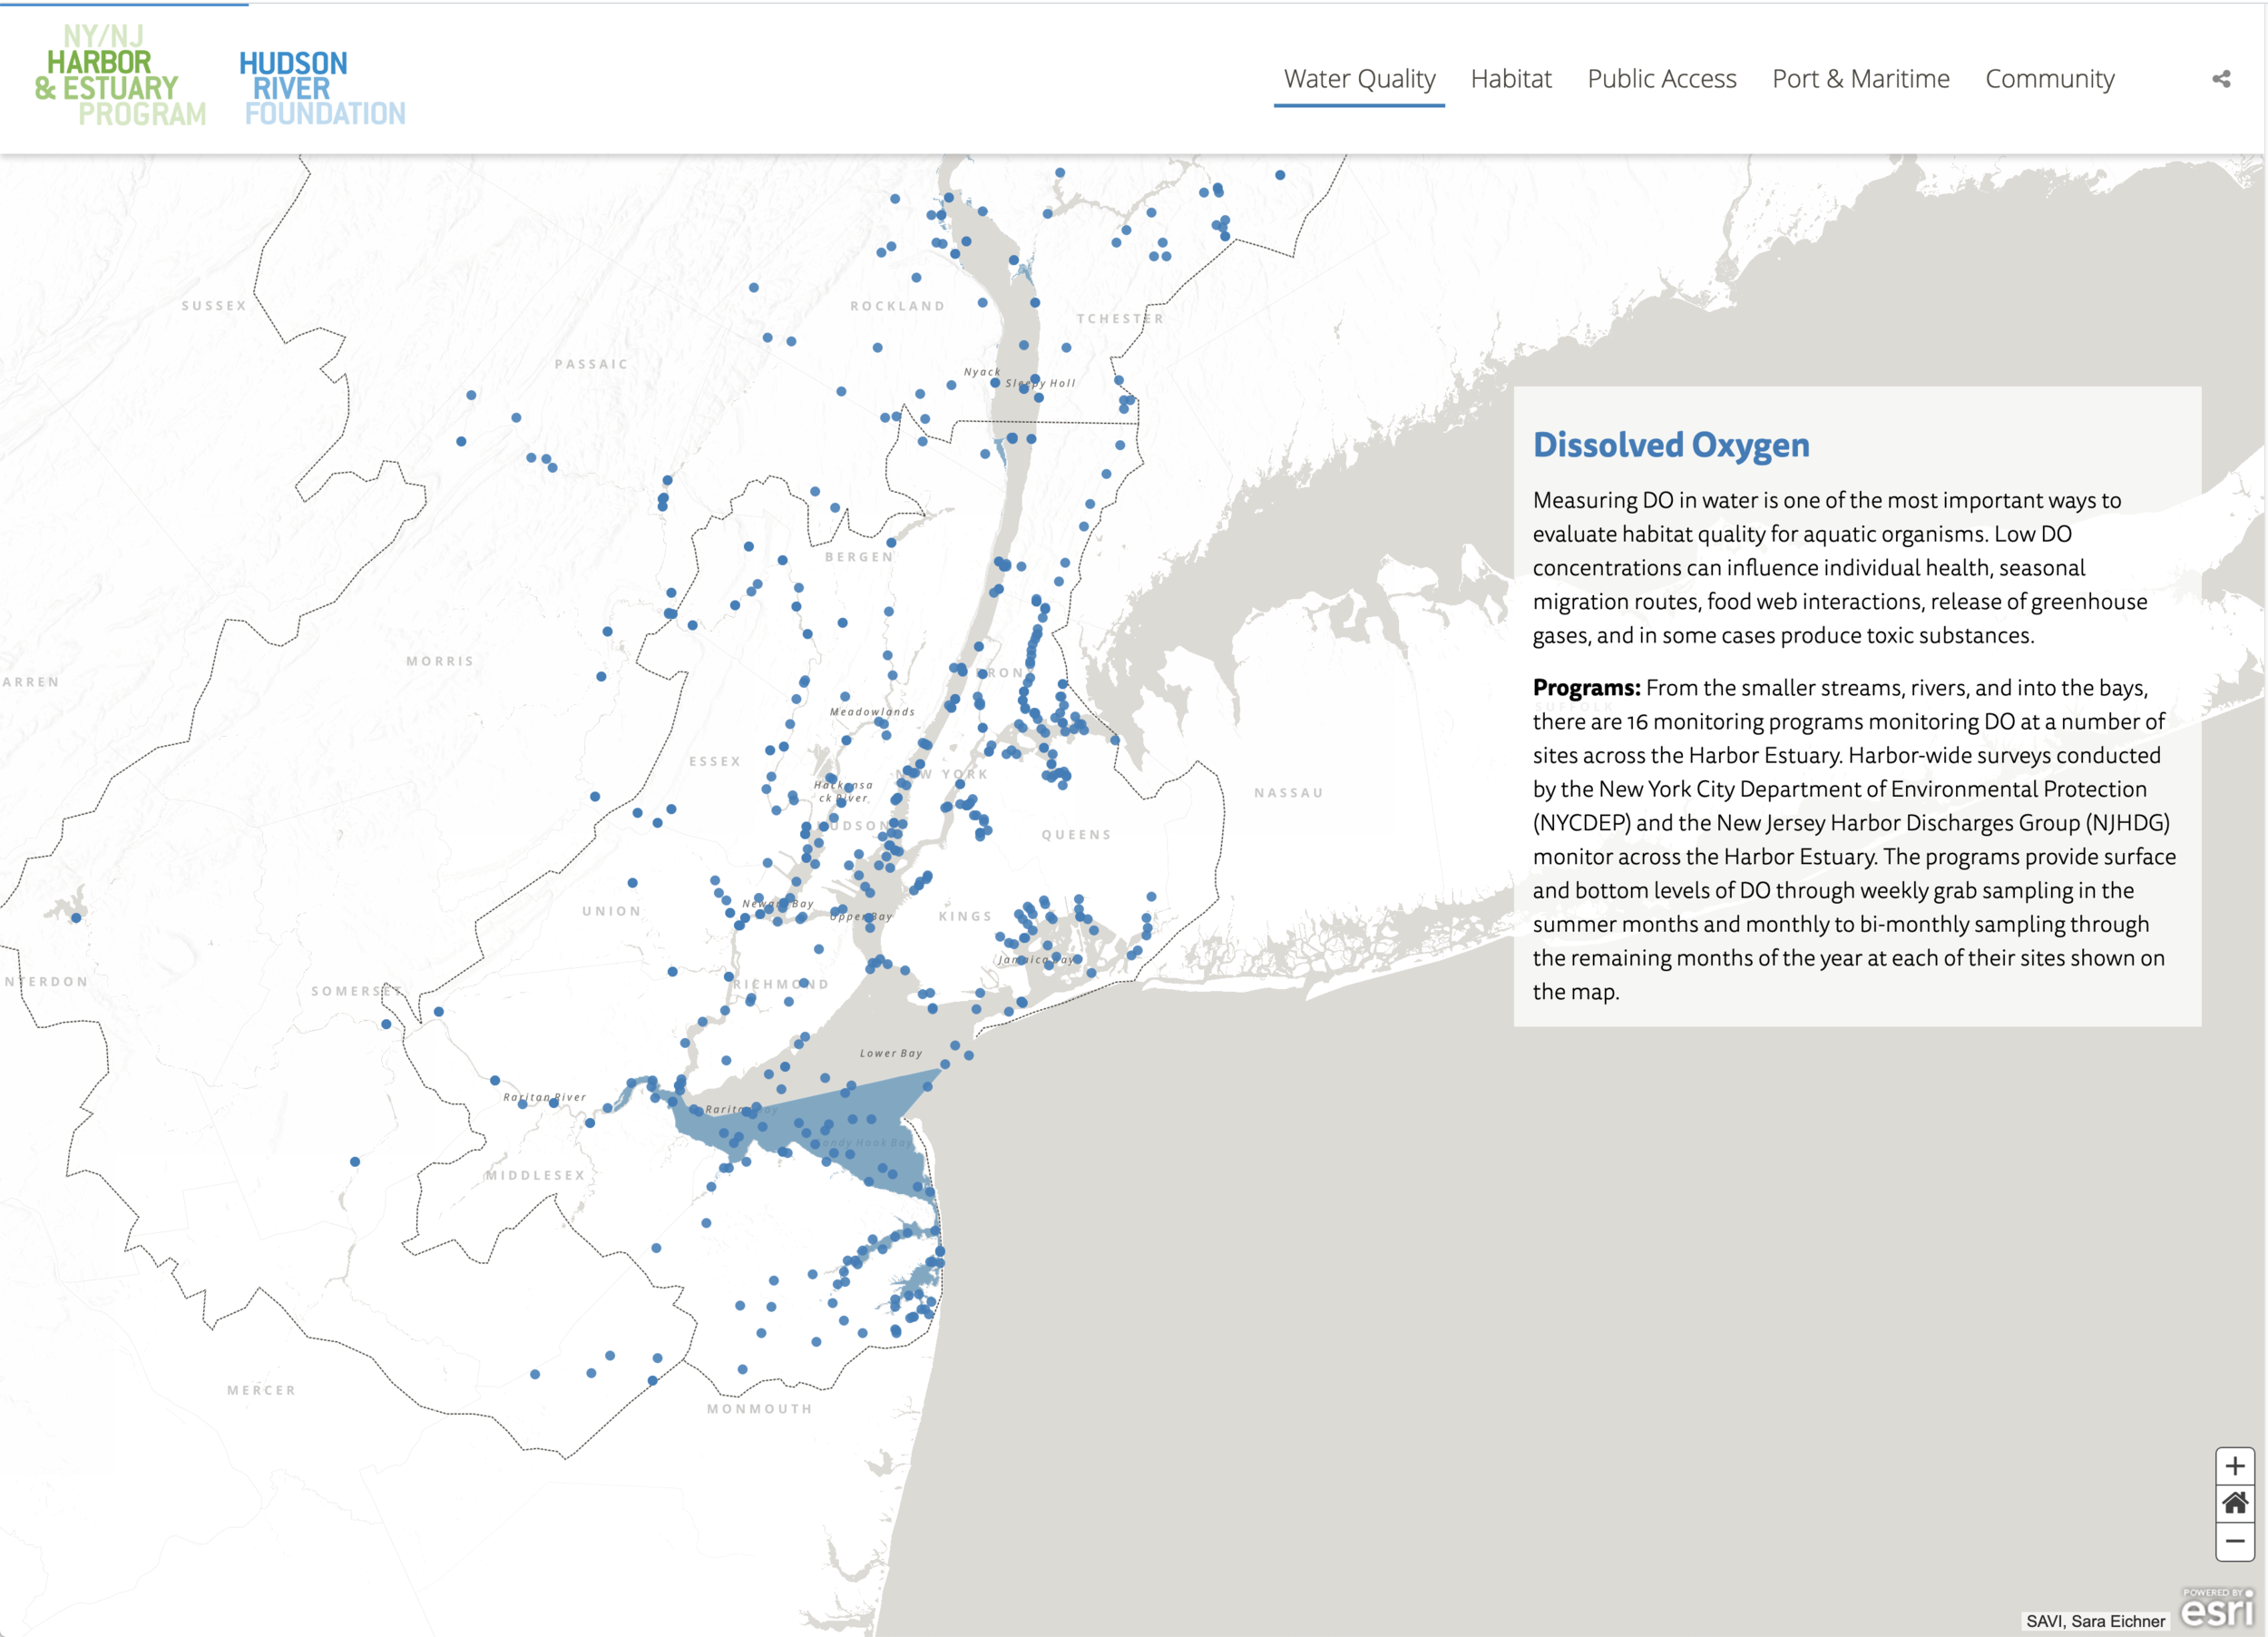
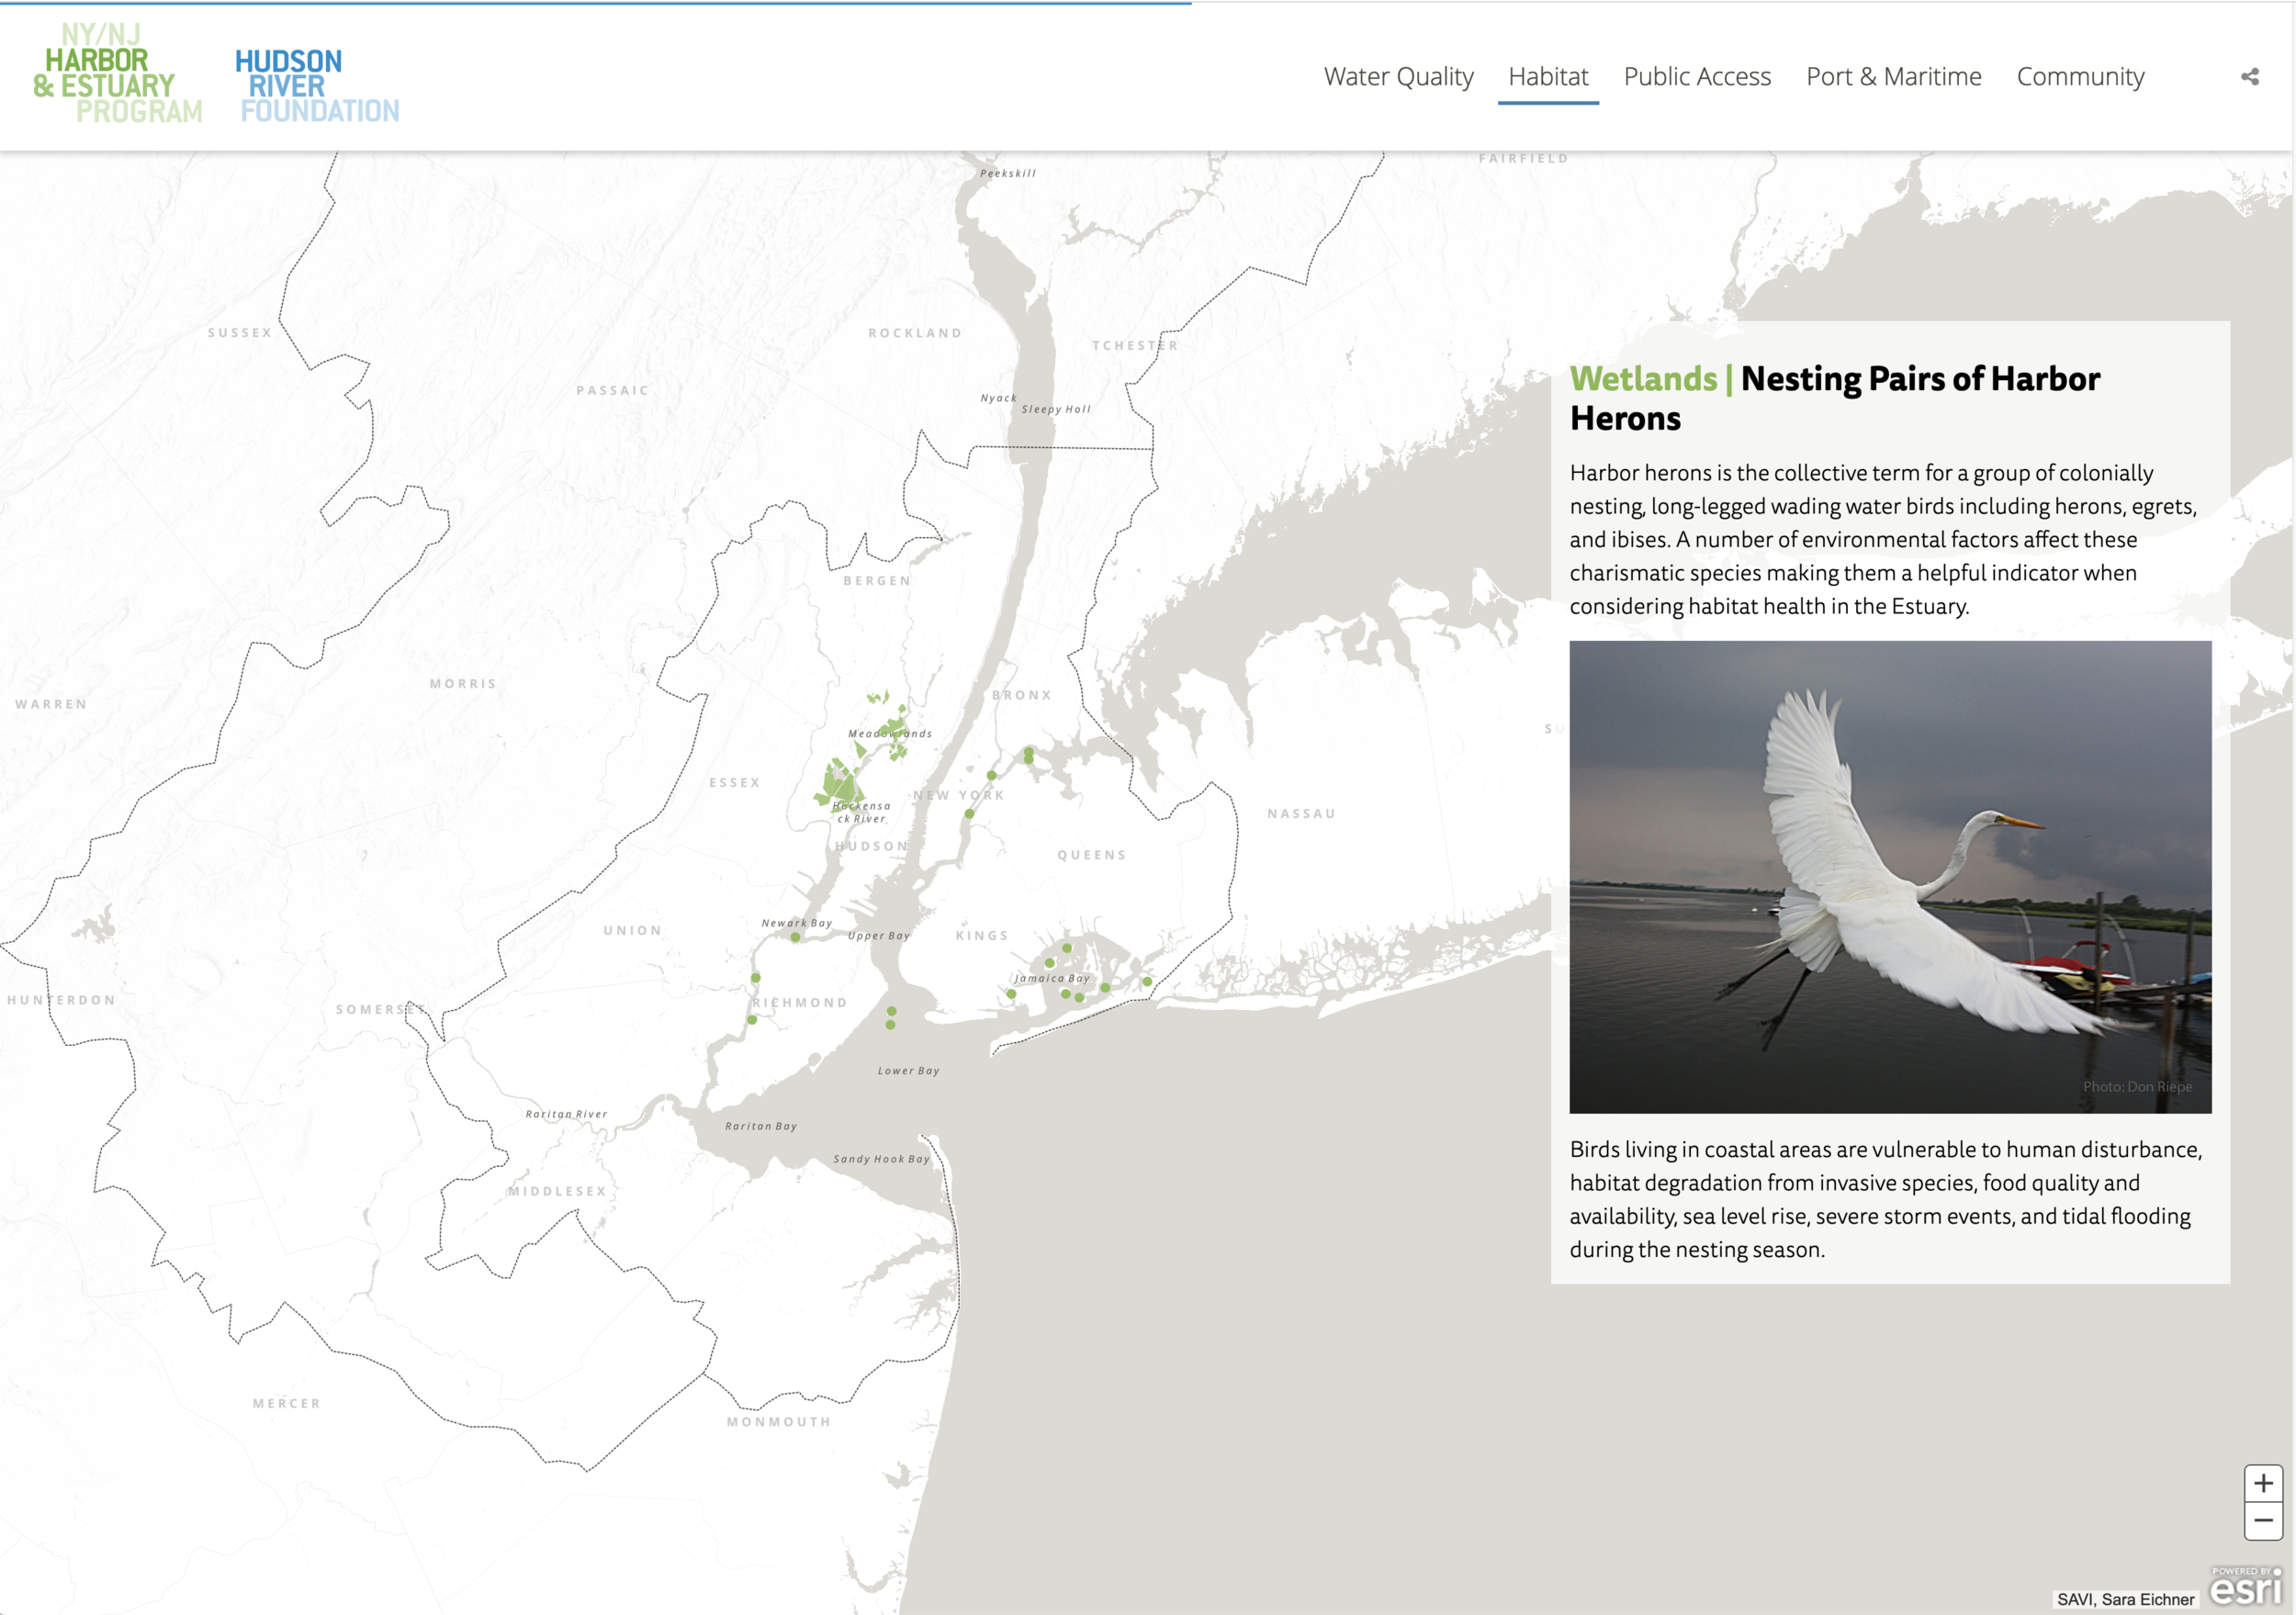
The Environmental Monitoring Plan is an interactive, guided story showing how estuary health is monitored.
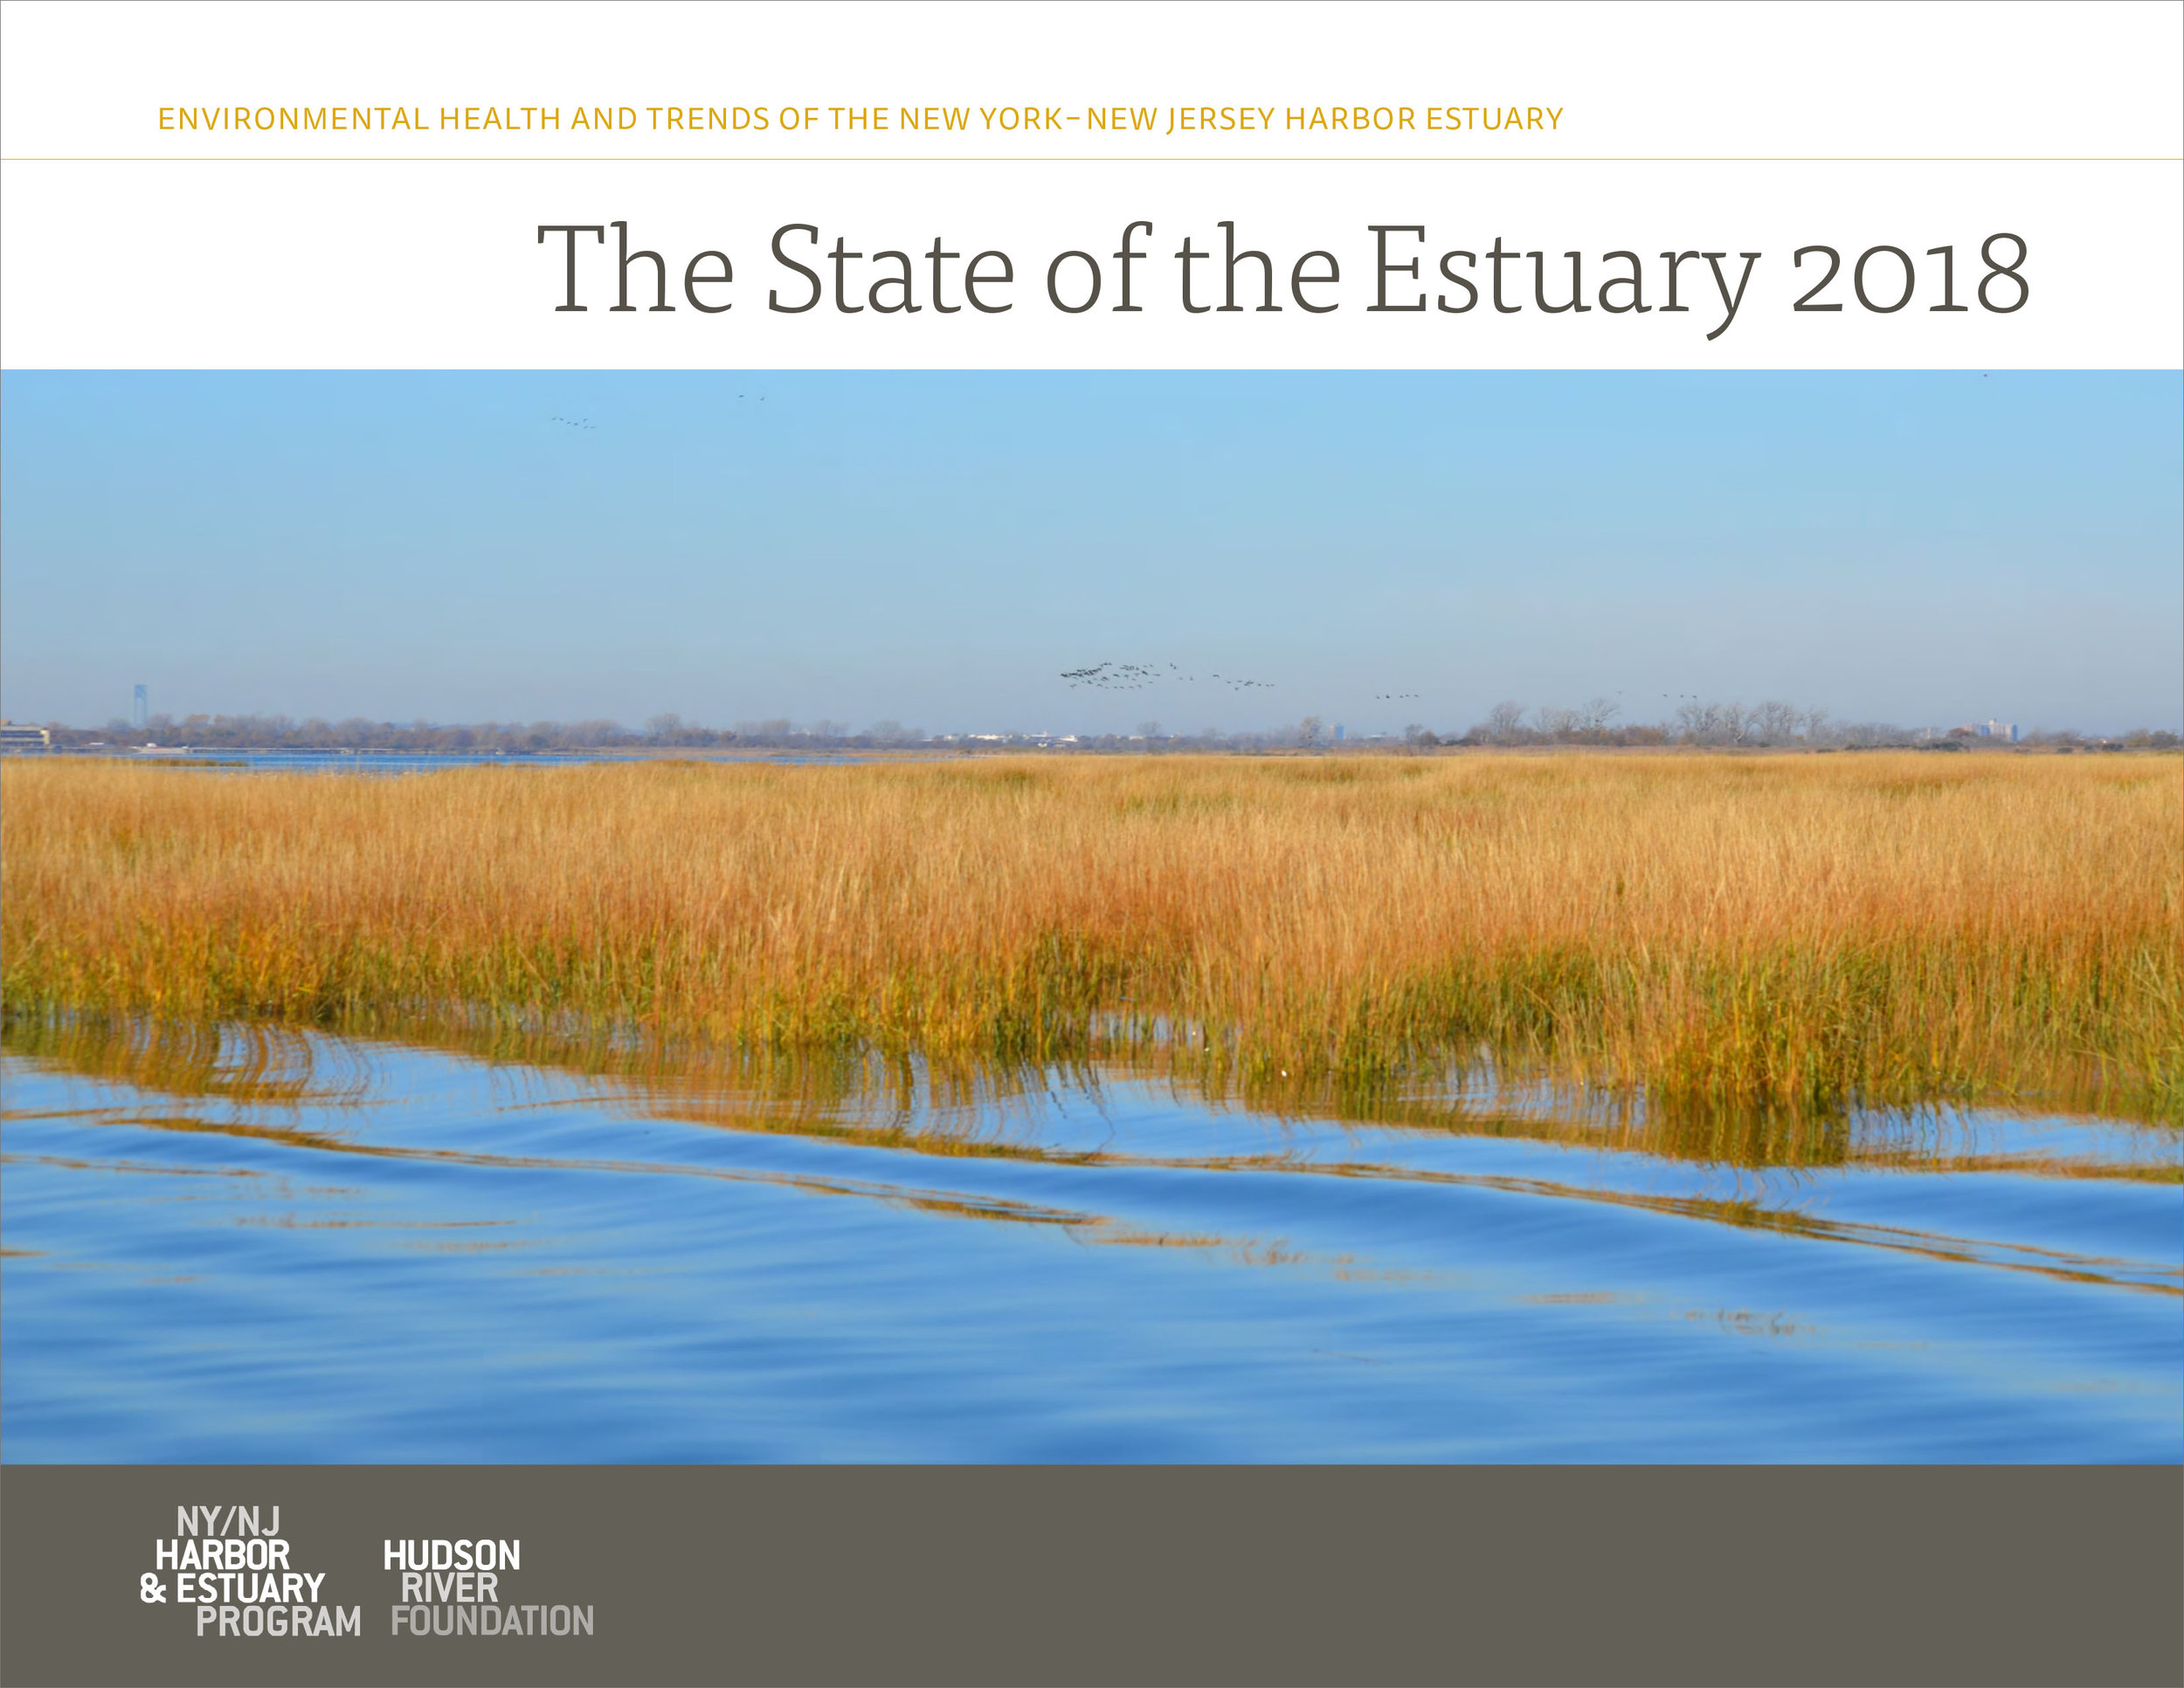
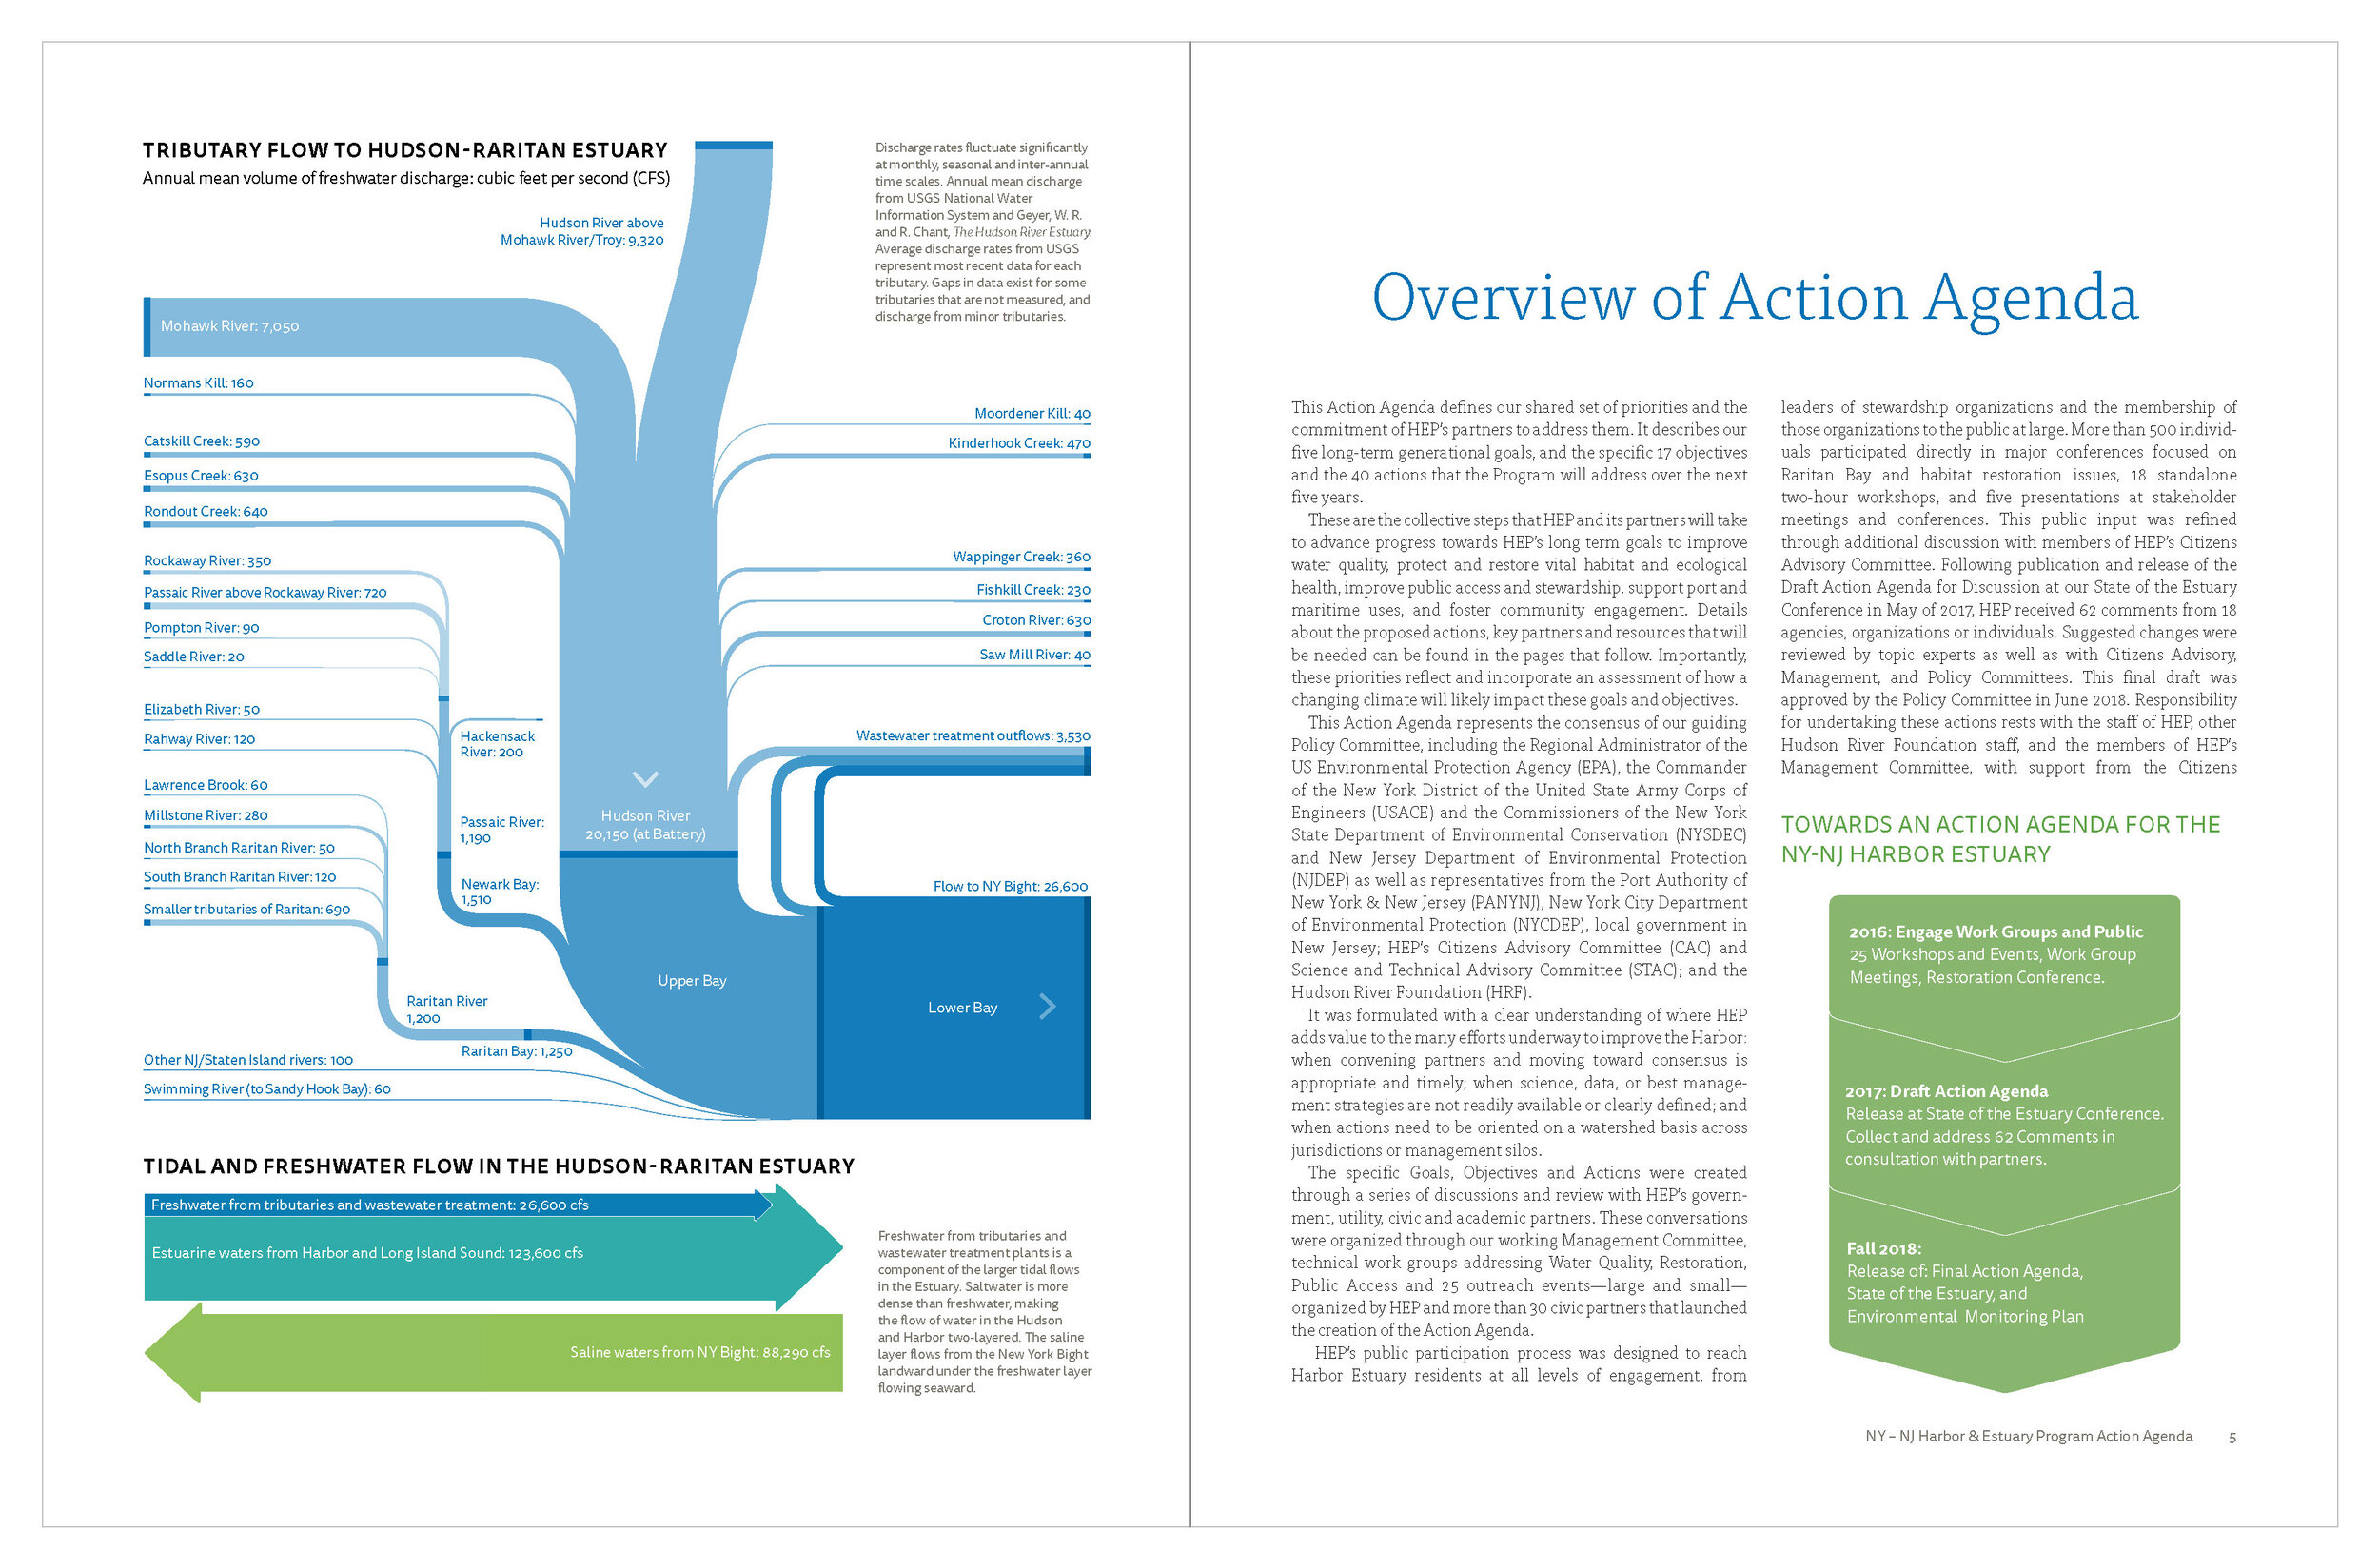
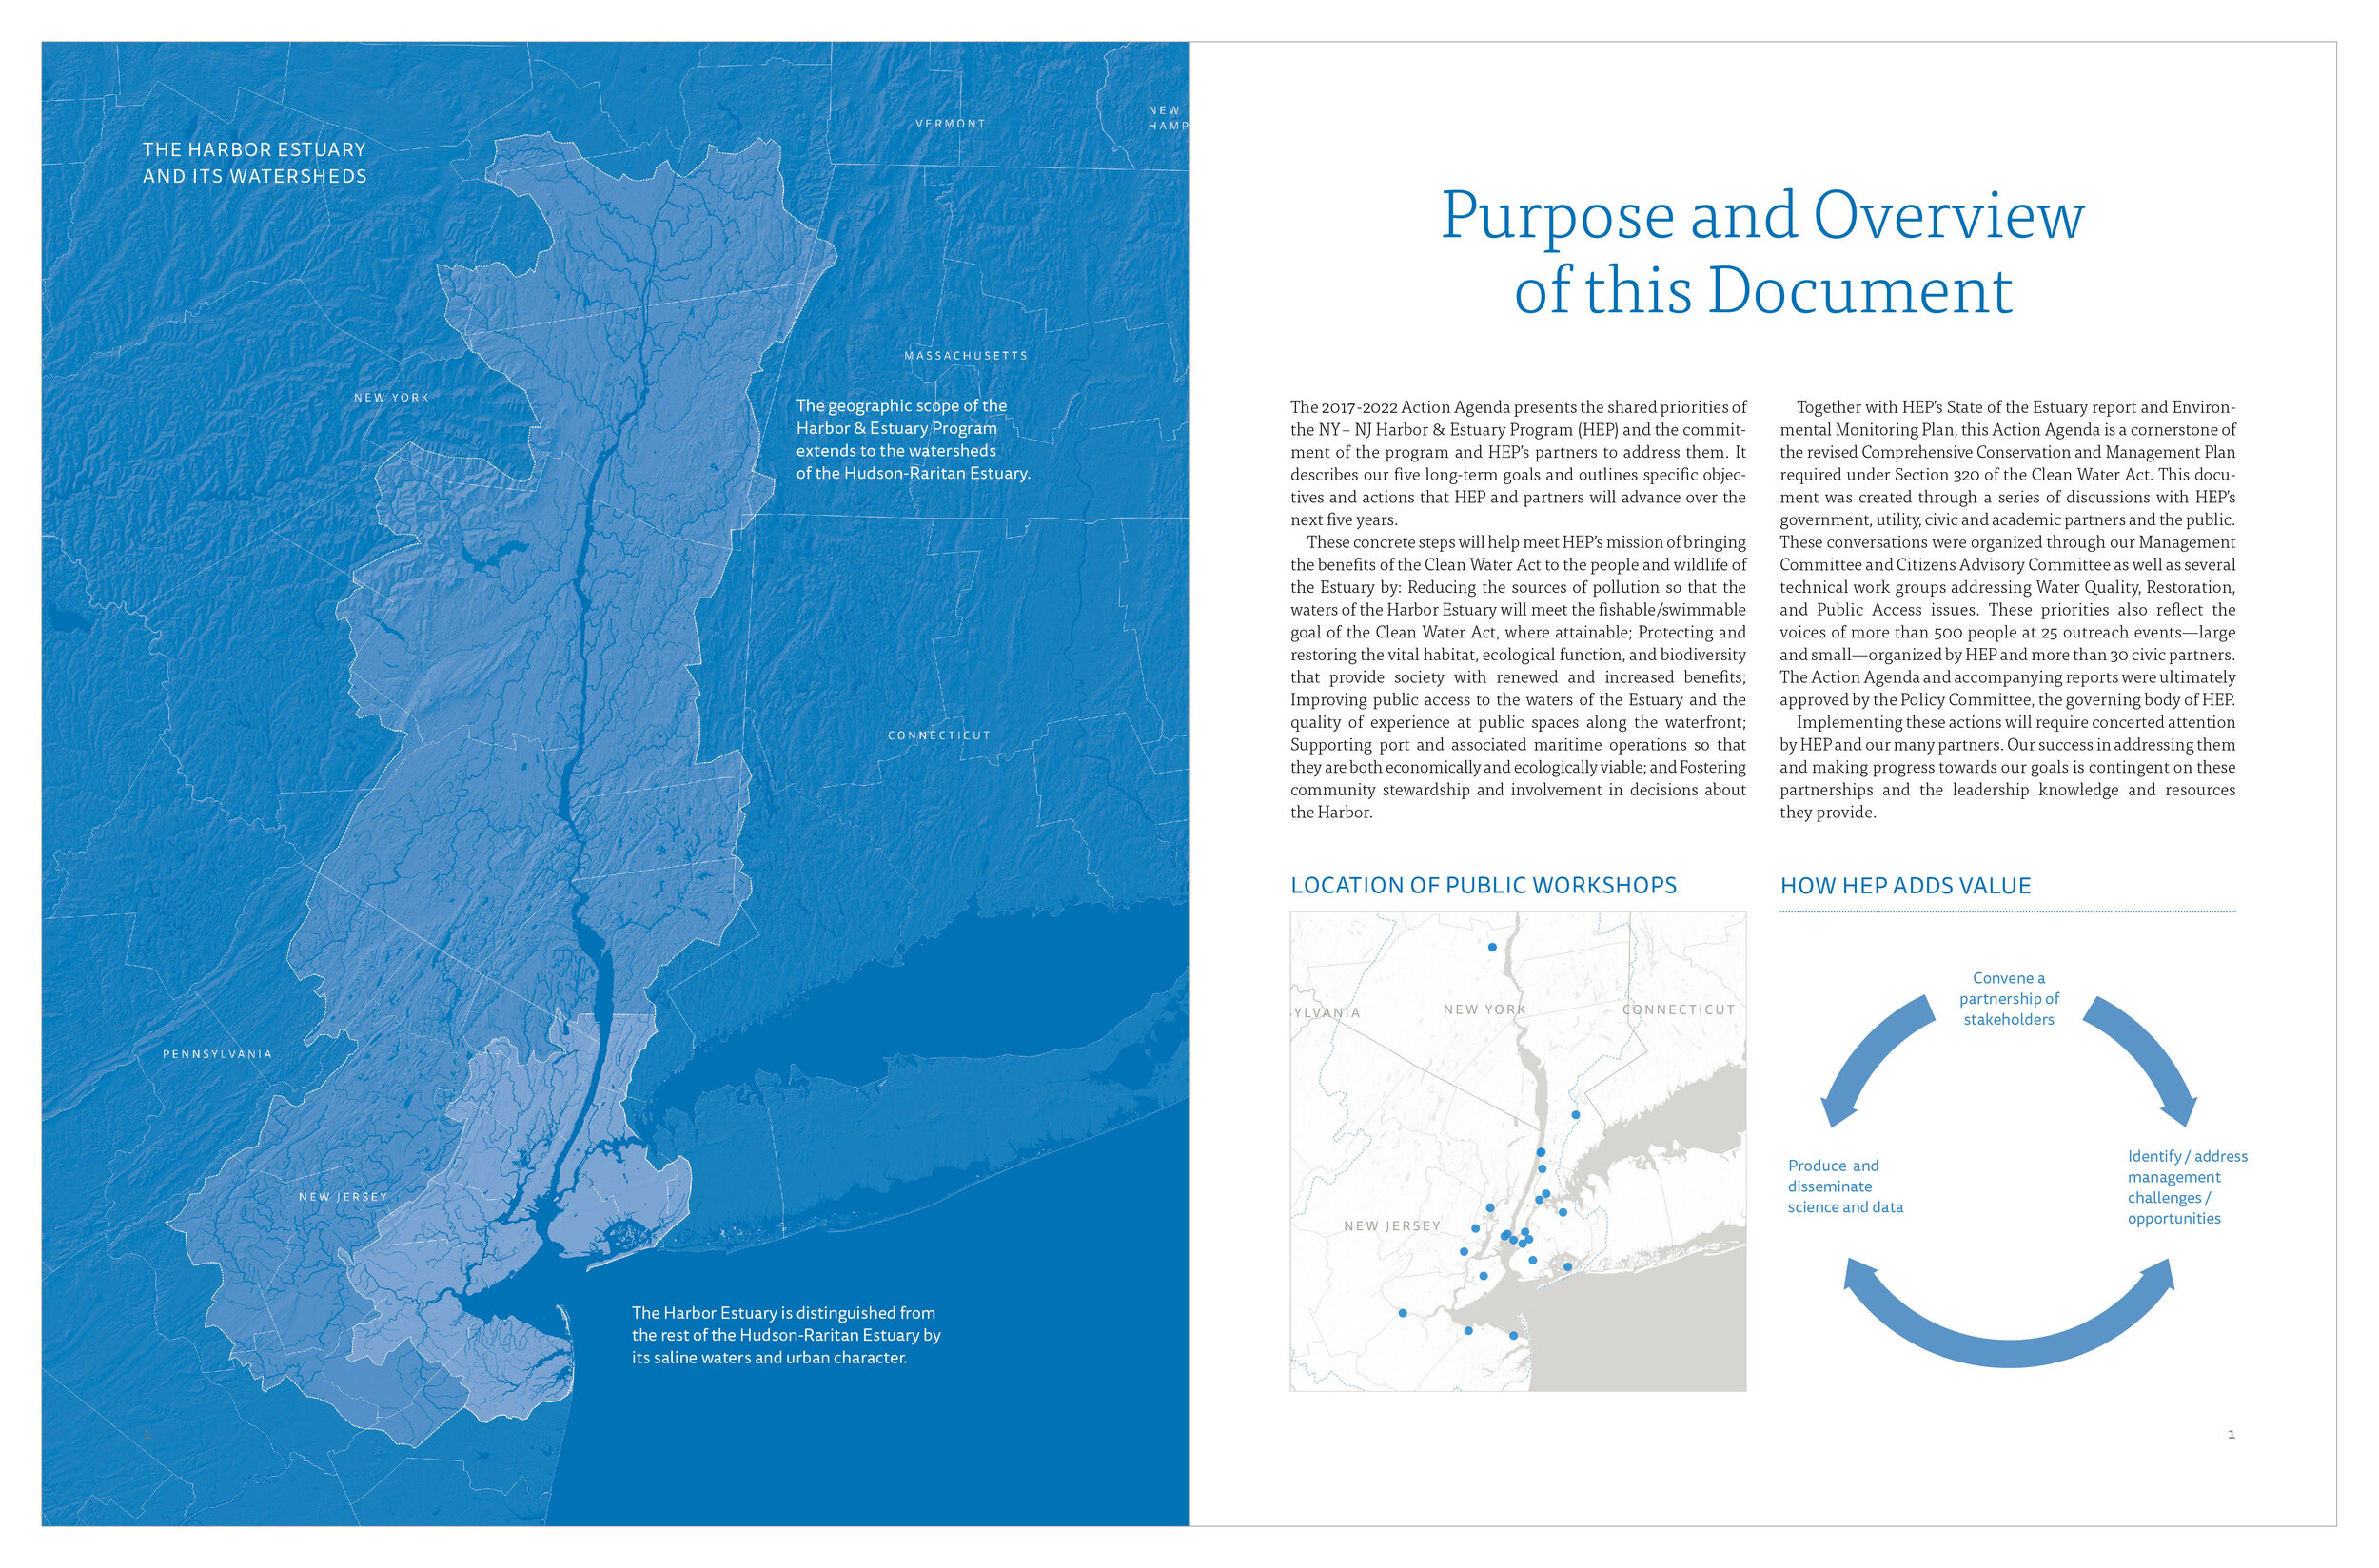
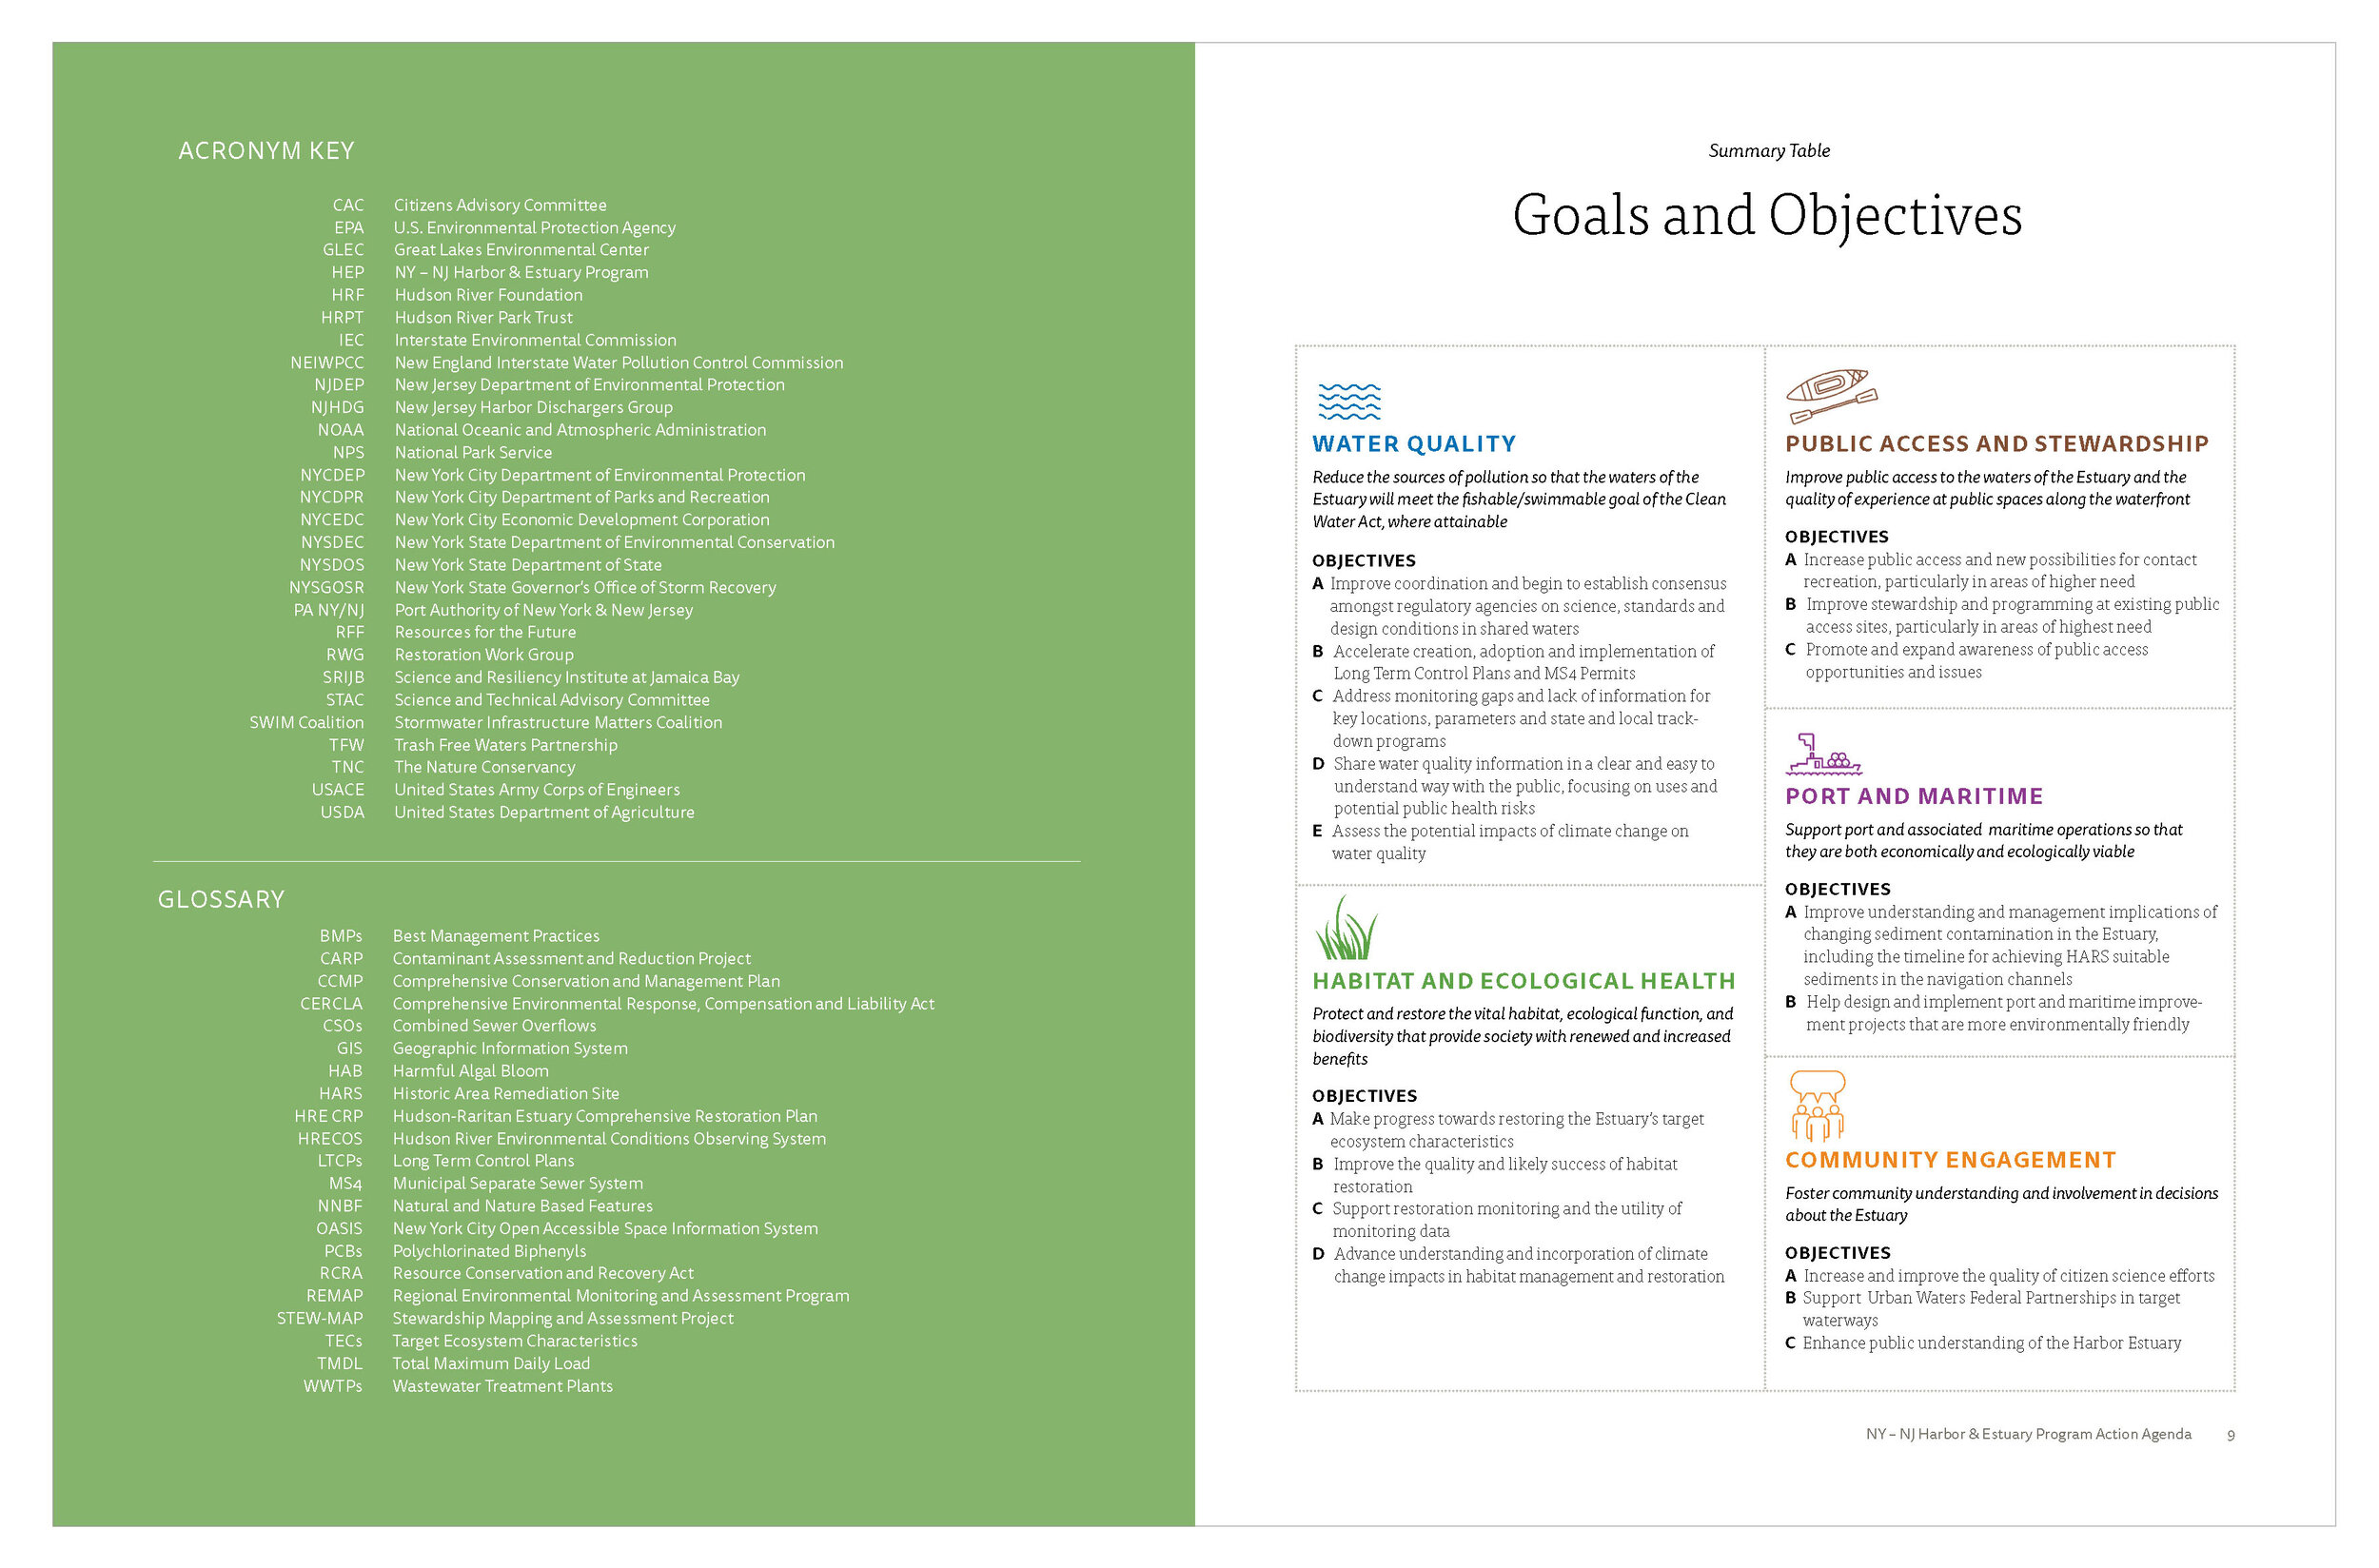
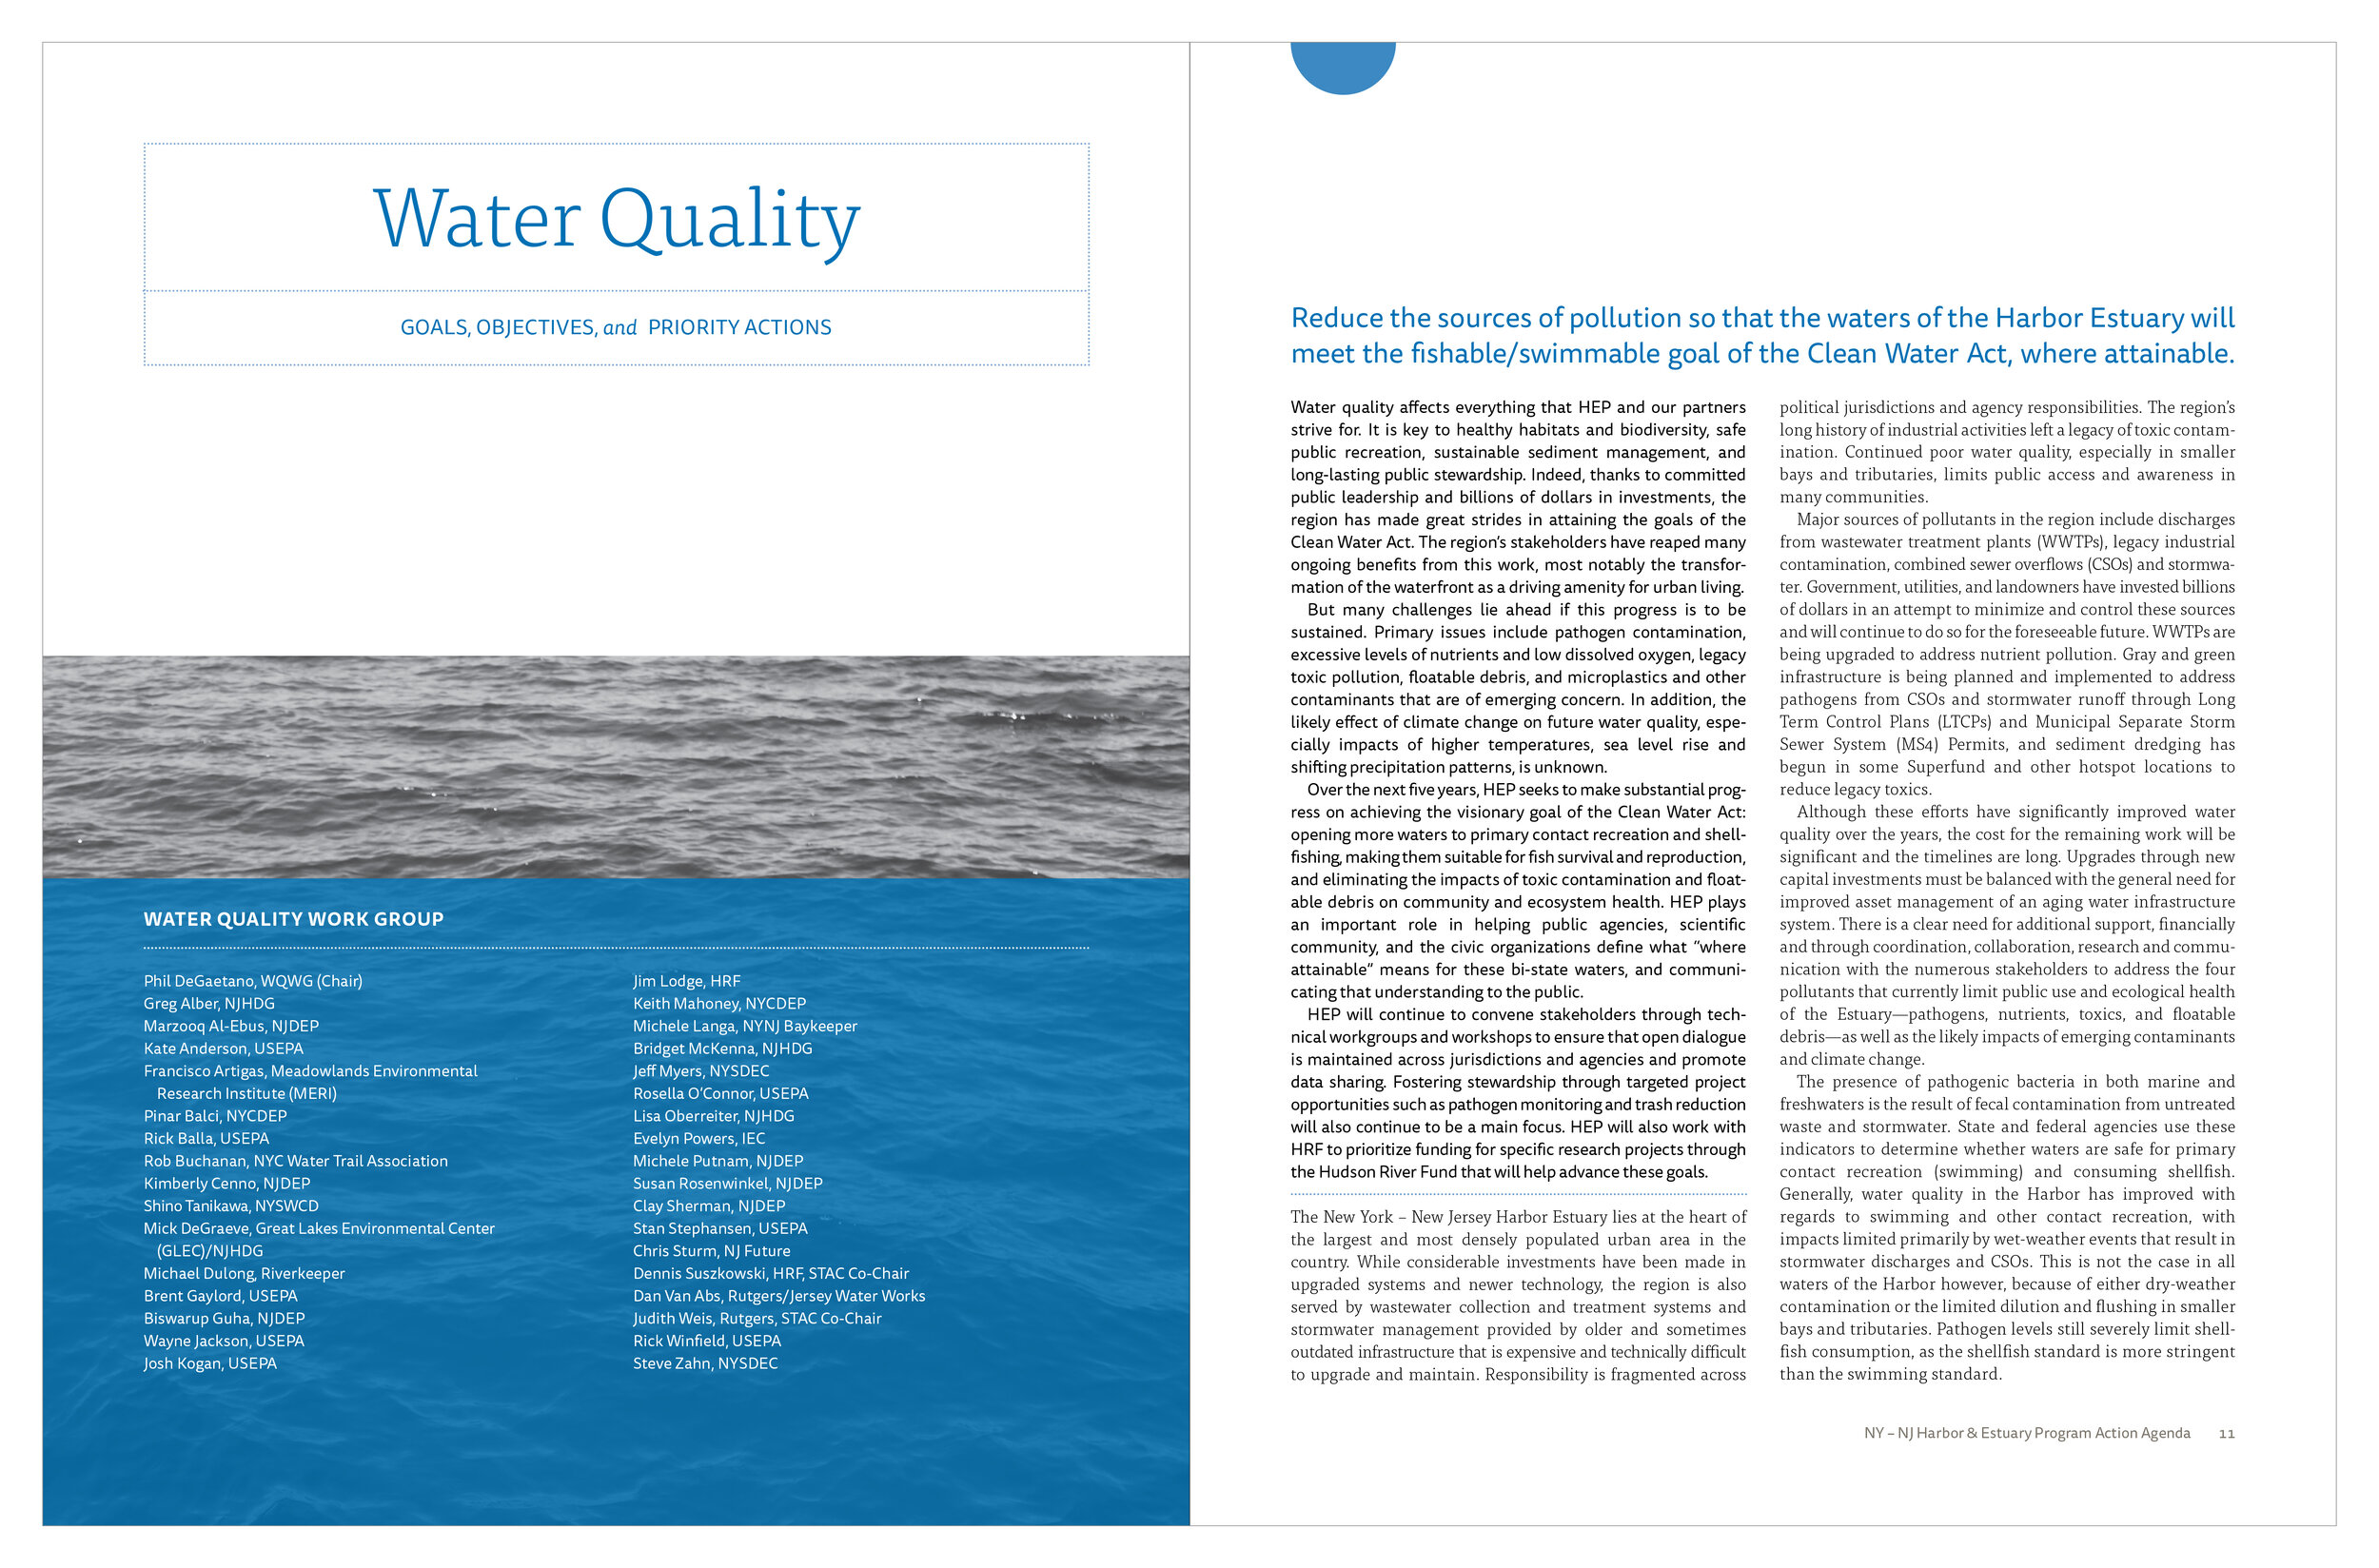
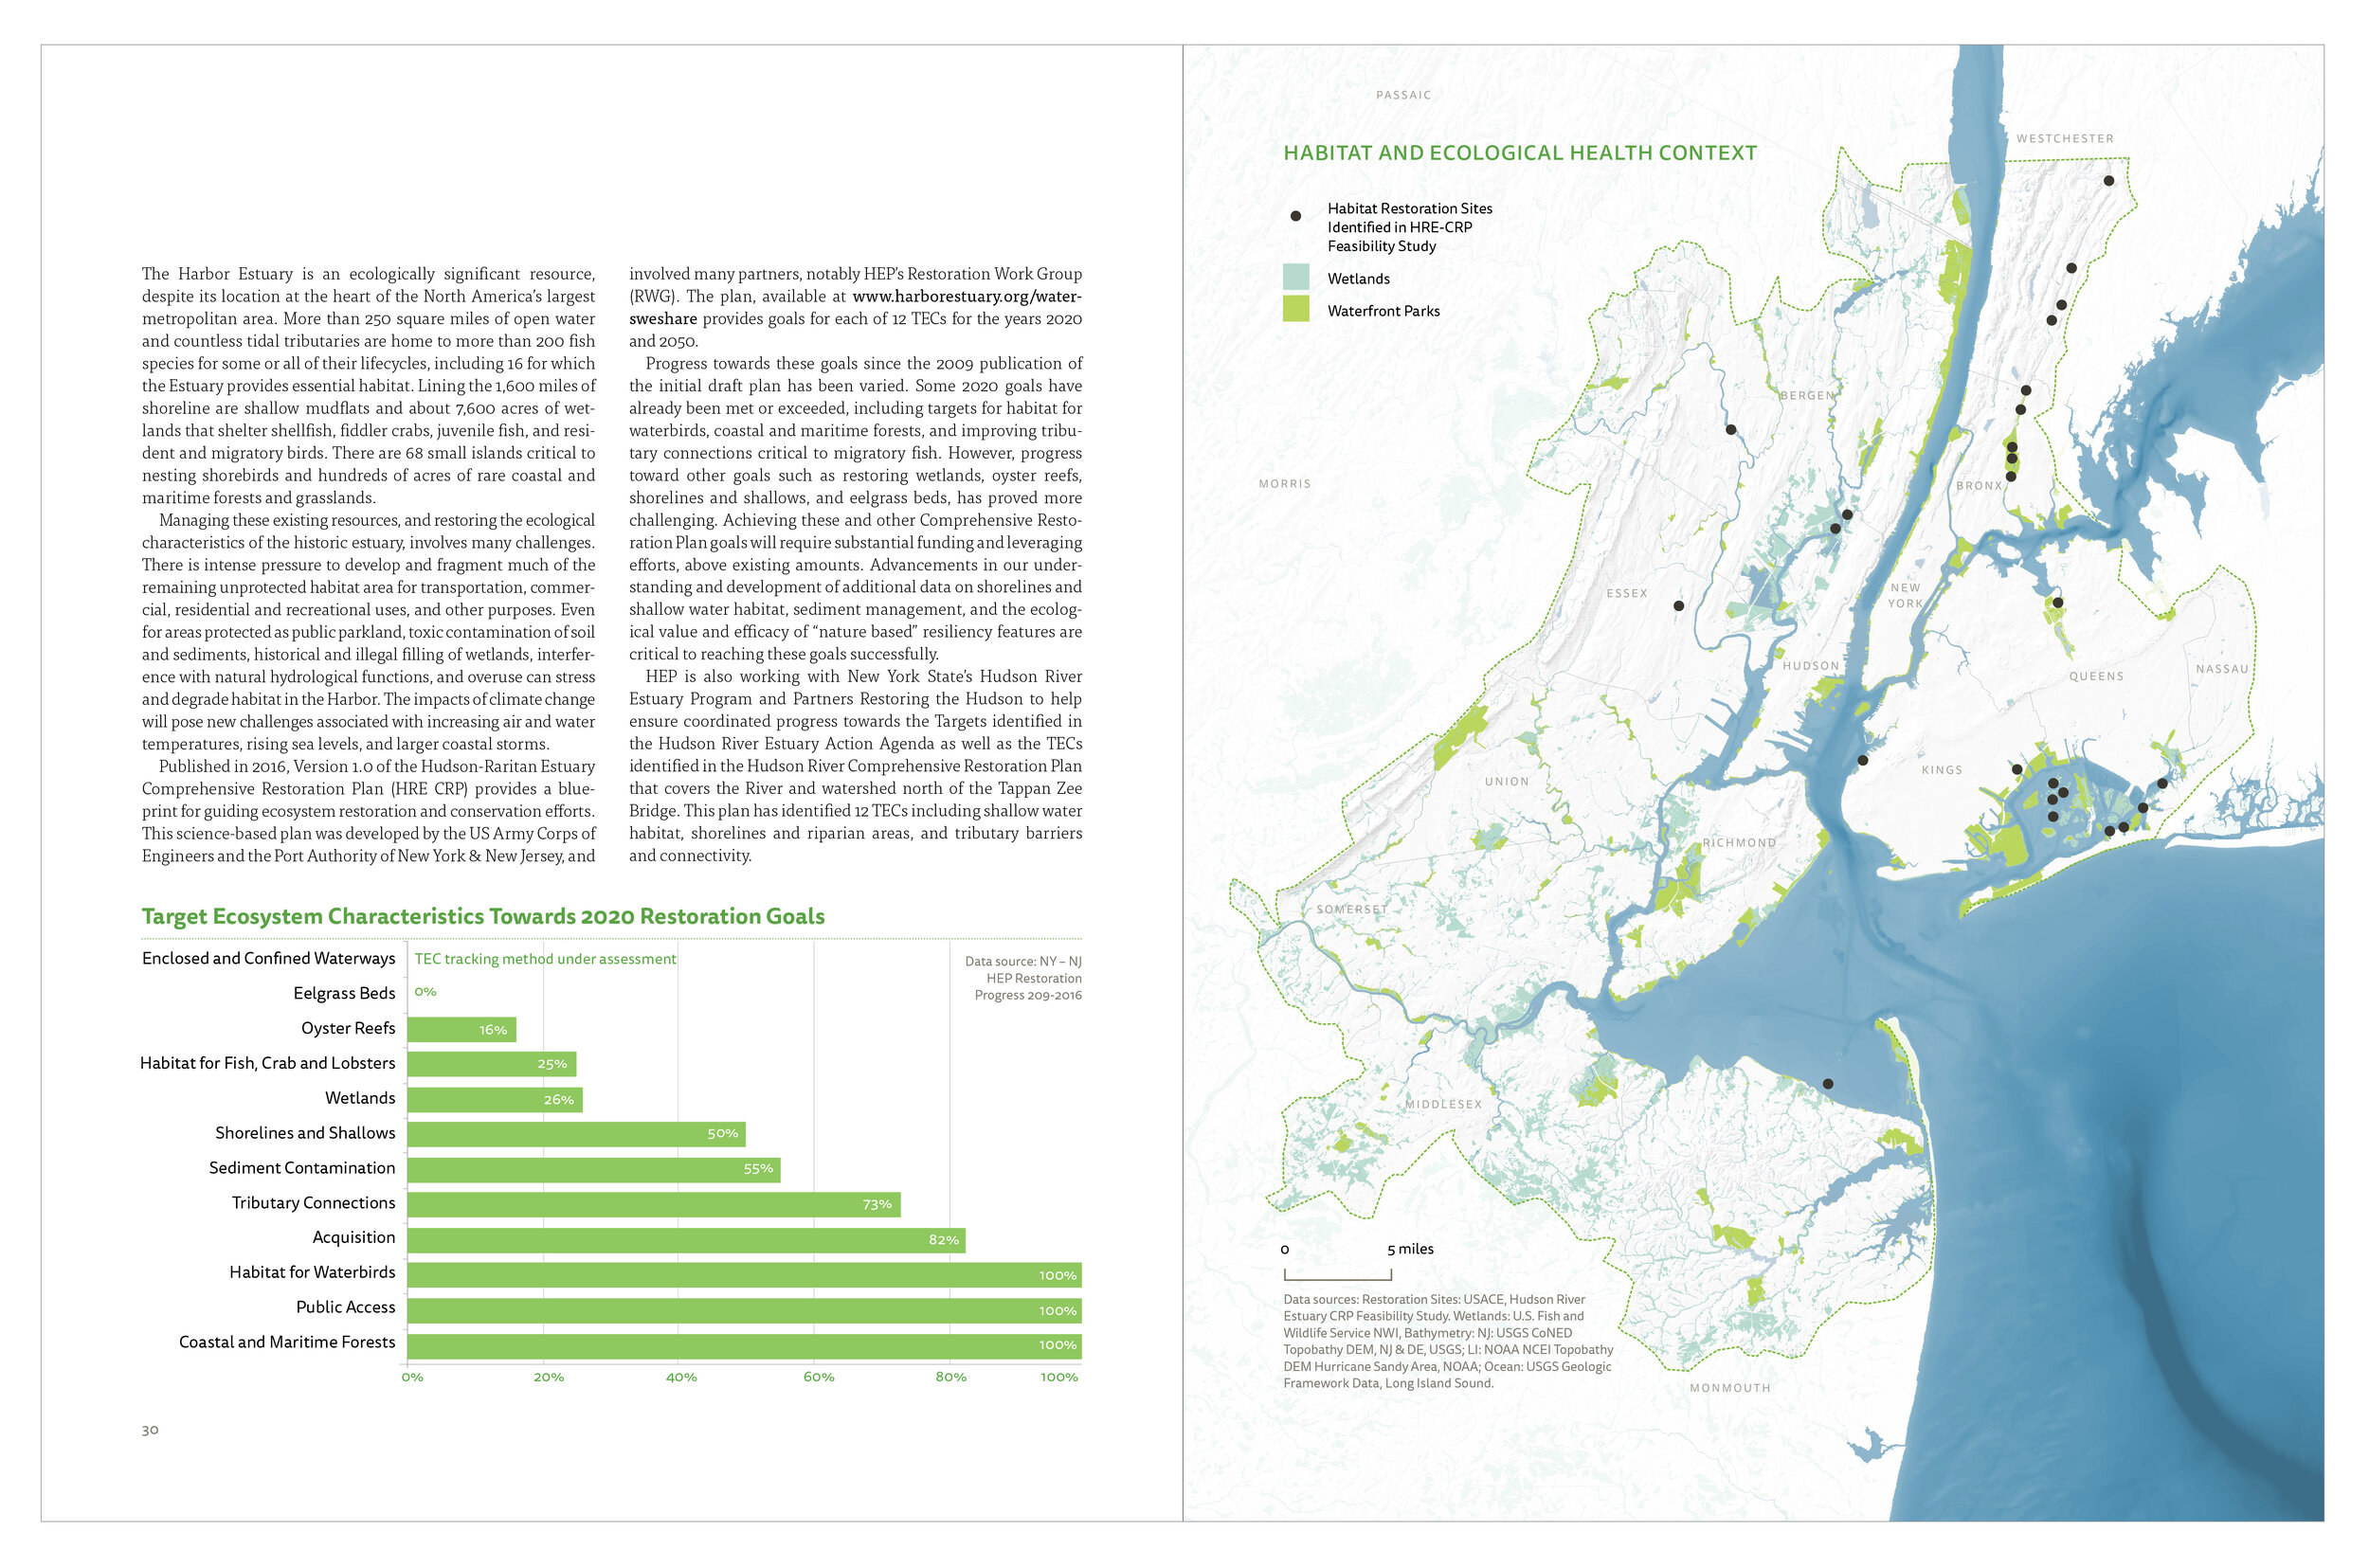
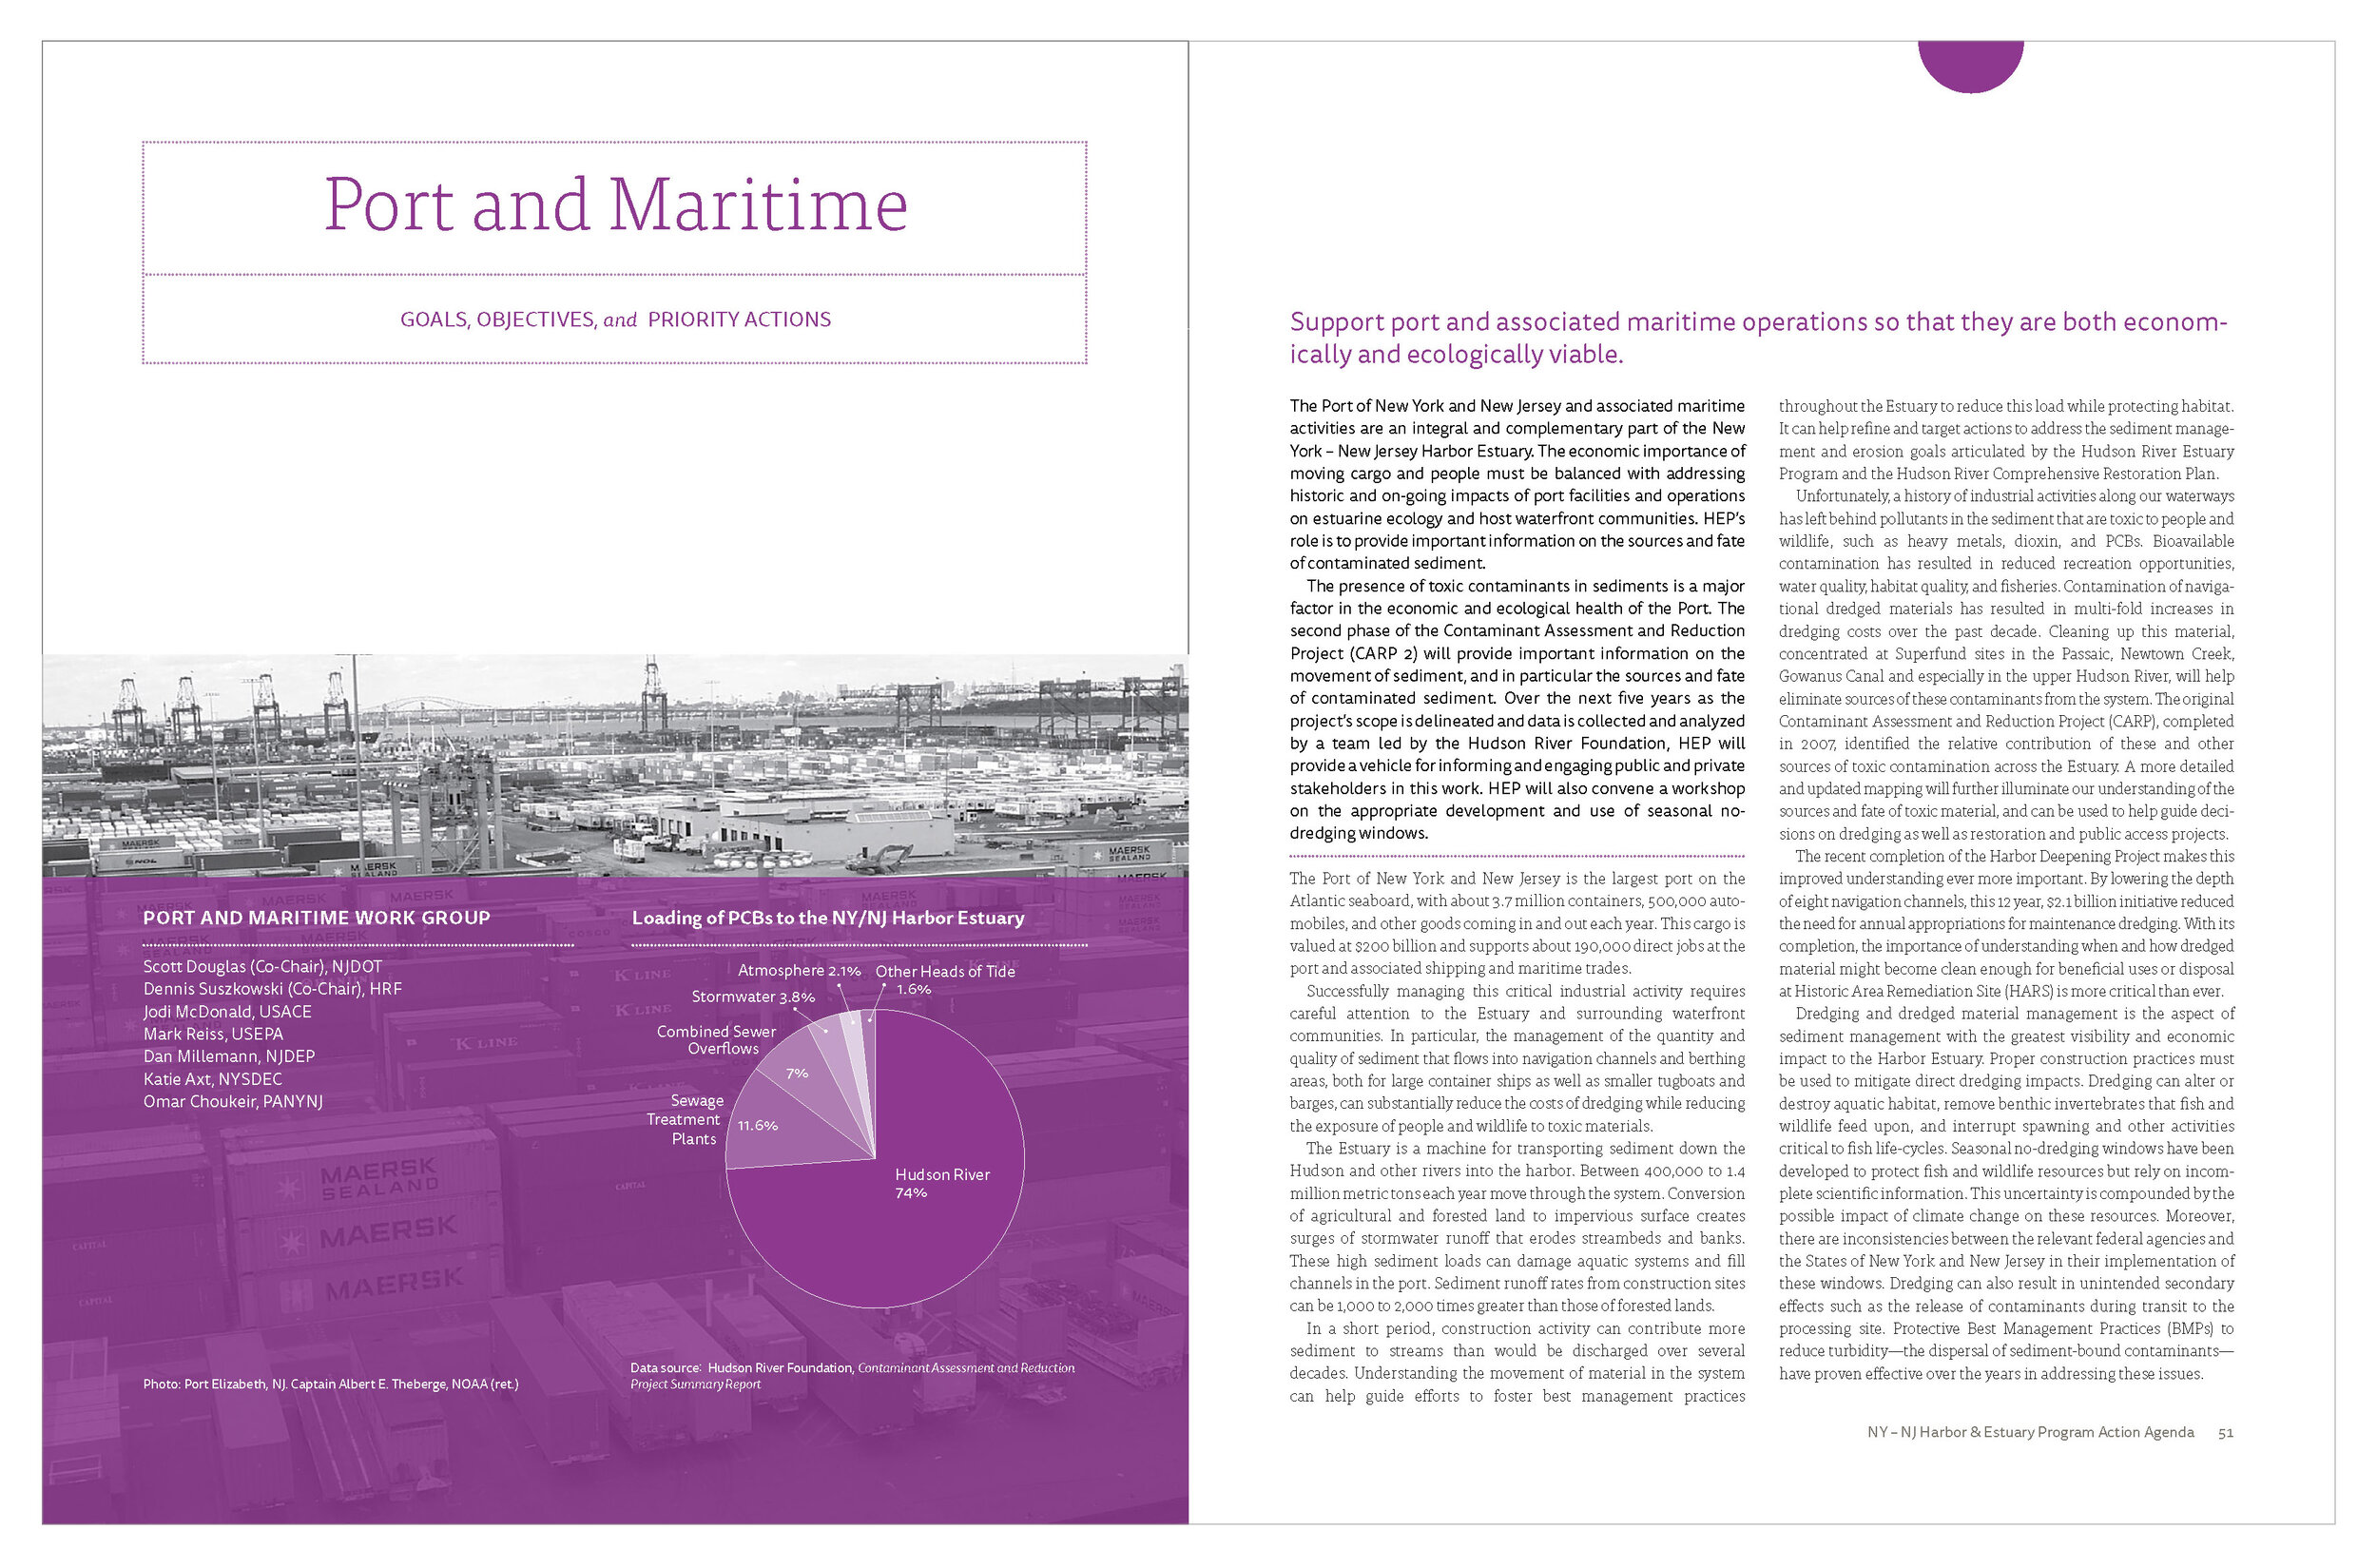
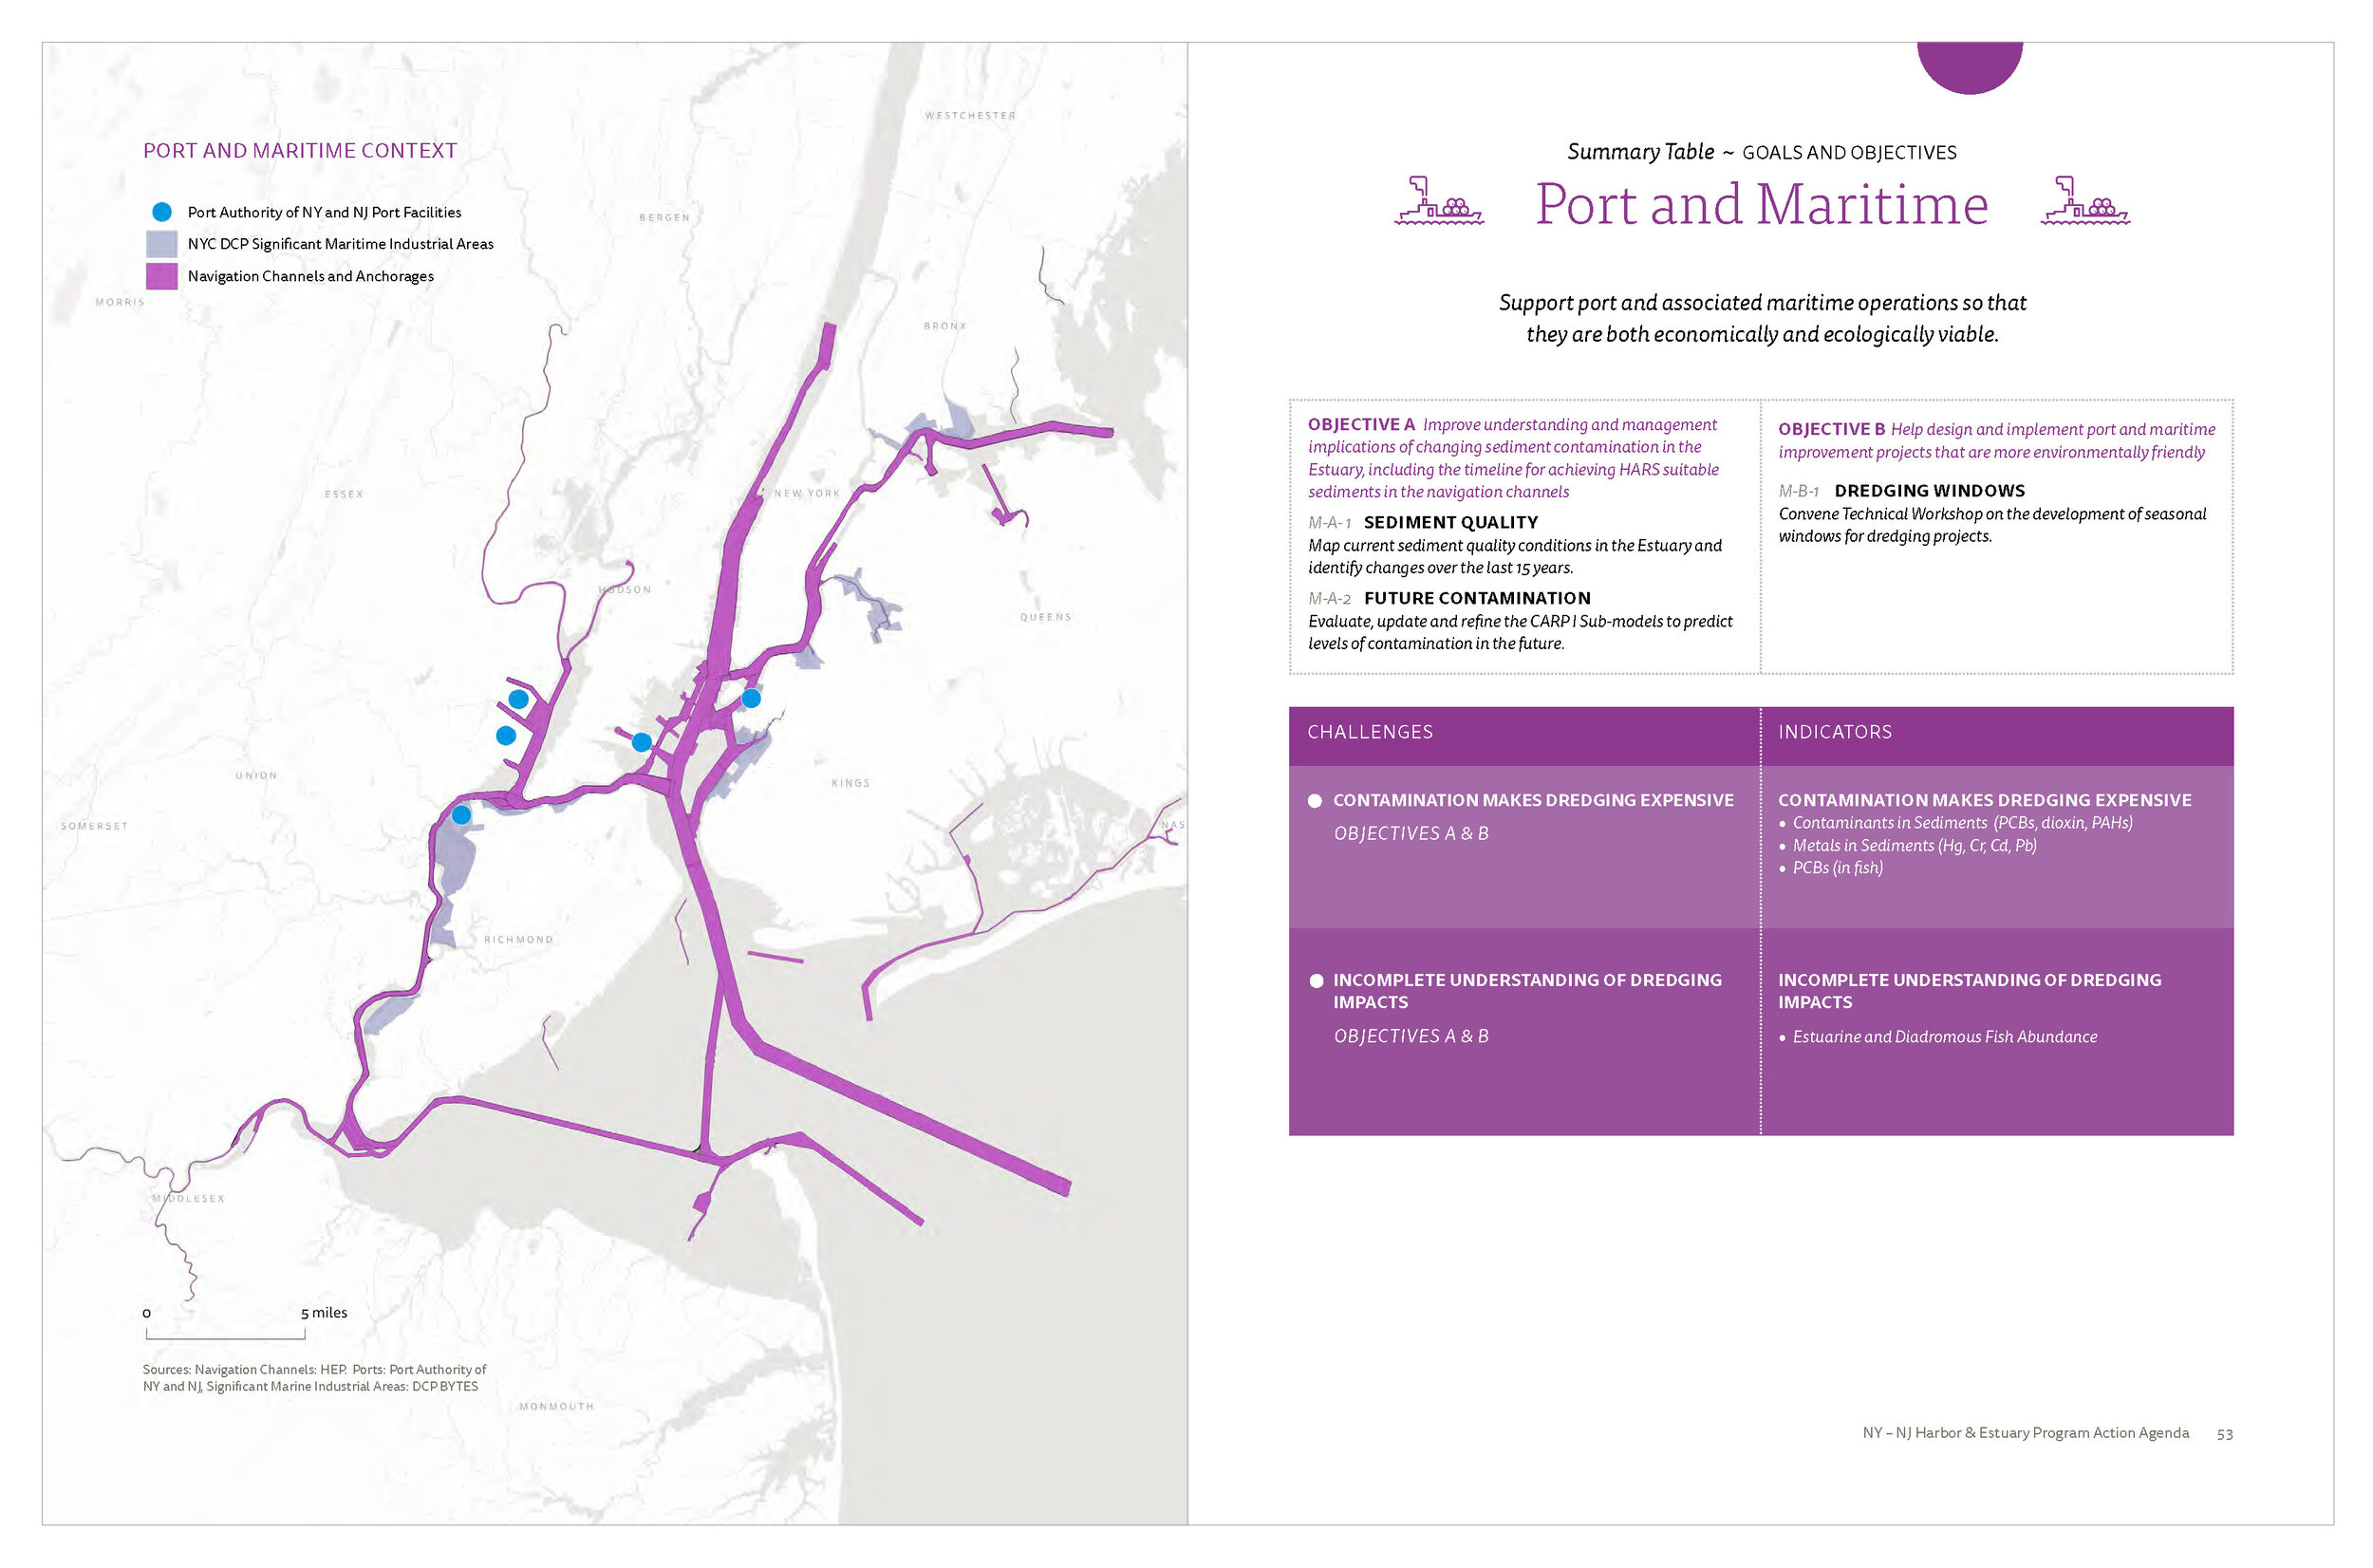
Below: Sample pages from The State of the Estuary


Part of the interactive components are sampled below. Each are linked to the interactive sites.