

CONCRETE WAVES
These maps were created for Gita Nandan of Thread Collective, a sustainable architecture and urban design firm in Brooklyn, NY. QGIS and New York City Open Data were used to create a geographic analysis of vacant land to identify potential sites for skateboard parks that will simultaneously provide stormwater remediation.

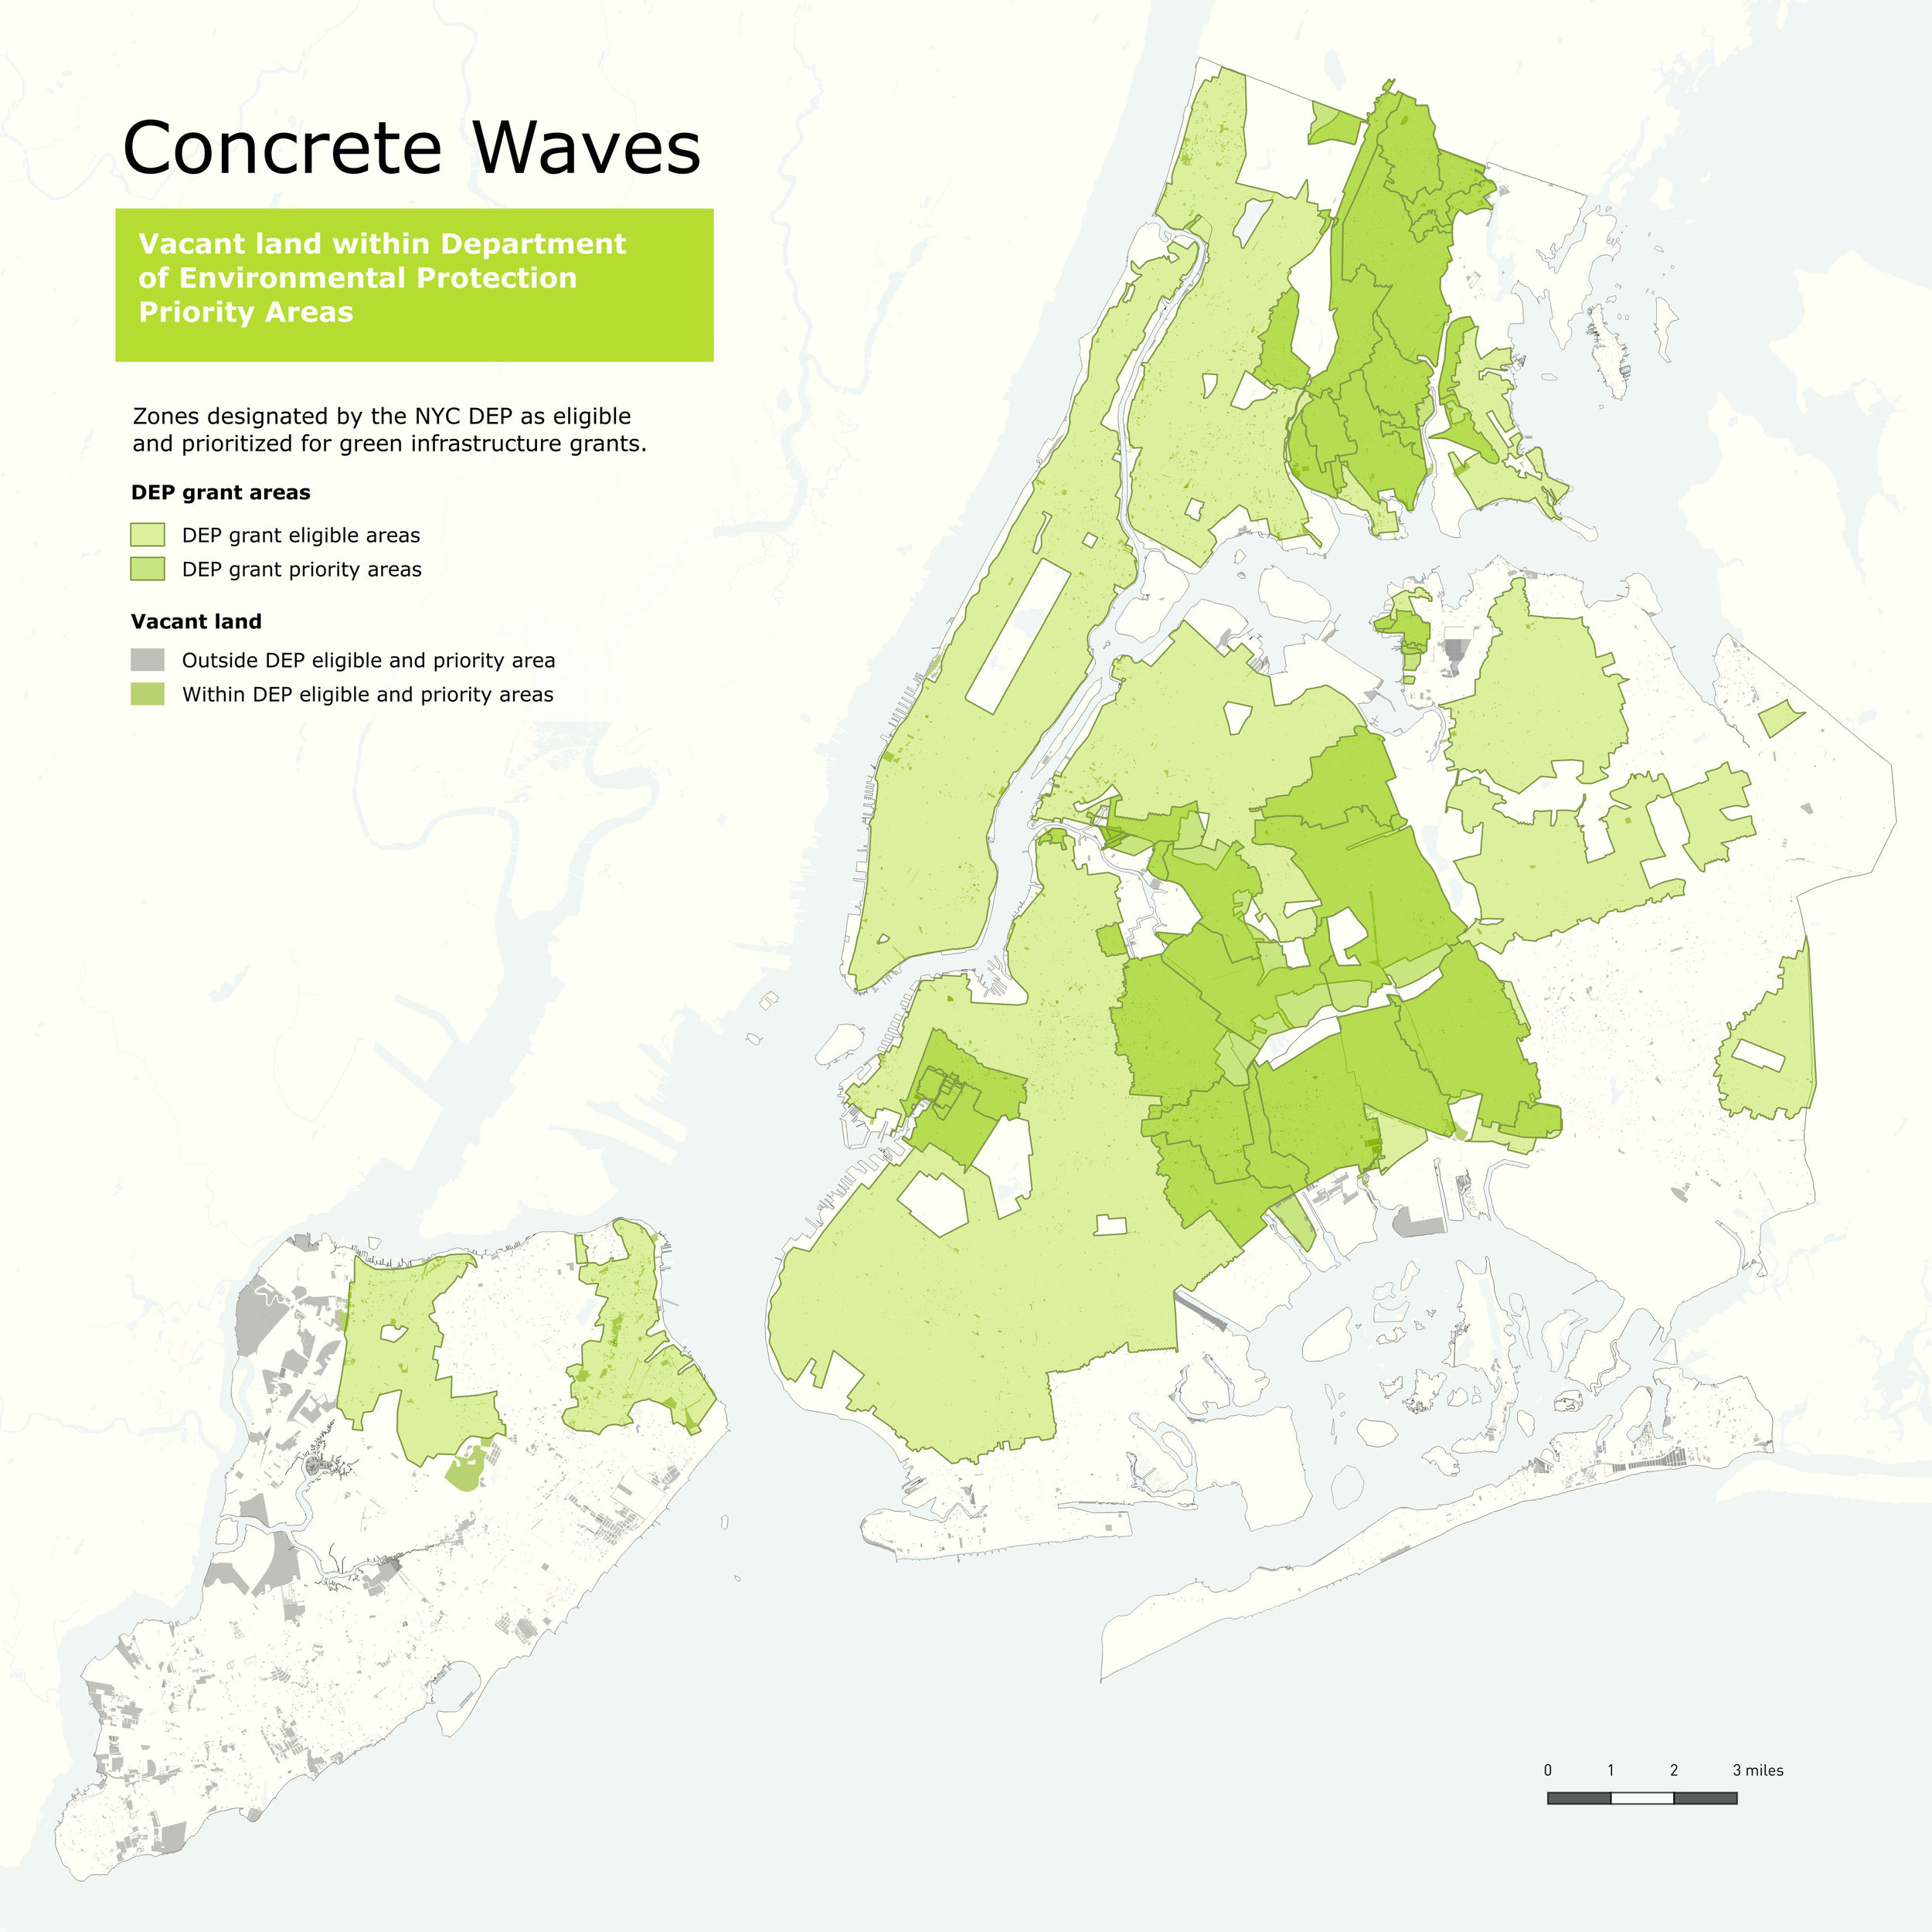
A database of vacant land in New York City was created and ranked based on criteria such as: public or private ownership, environmental grant priority areas, elevation, flood vulnerability, high poverty, proximity to high schools, census demographics and land use.
Tools and resources: QGIS, NYC Open Data, NYC Department of Finance tax lot data, LivingLots/596 Acres, US Census, DEP

Hurricane Sandy inundation areas are used to locate vacant land prone to flooding.
Sites within one mile of existing skateparks are eliminated.

Areas with high rates of poverty. Data from US Decennial Census, 2010.

Vacant land ranked based on all criteria used in the analysis.

The second pass of analysis in progress. It looks more closely at factors contributing to flood vulnerability. Because no data was available showing inundation rates after 1 inch of rain in New York City, 311 complaints of clogged catch water basins were used instead. Hex bins normalize complaint density and show the areas of highest complaint frequency over the last six years.

Additional maps show rates of complaints about street flooding, as well as predictions of sea level rise over the next century.