SITE X SITE
The goal of SITE x SITE is to provide more reliable information about past development so that estimates of future development and potential impacts are rooted in actual trends. Ultimately, SITE x SITE seeks to improve CEQR so that city planners and decision makers can better serve communities and communities themselves can be better informed in the City’s public land use and environmental review processes. The SITE x SITE initiative also includes a report with detailed methodology, key findings and recommendations, and case studies. (MAS)
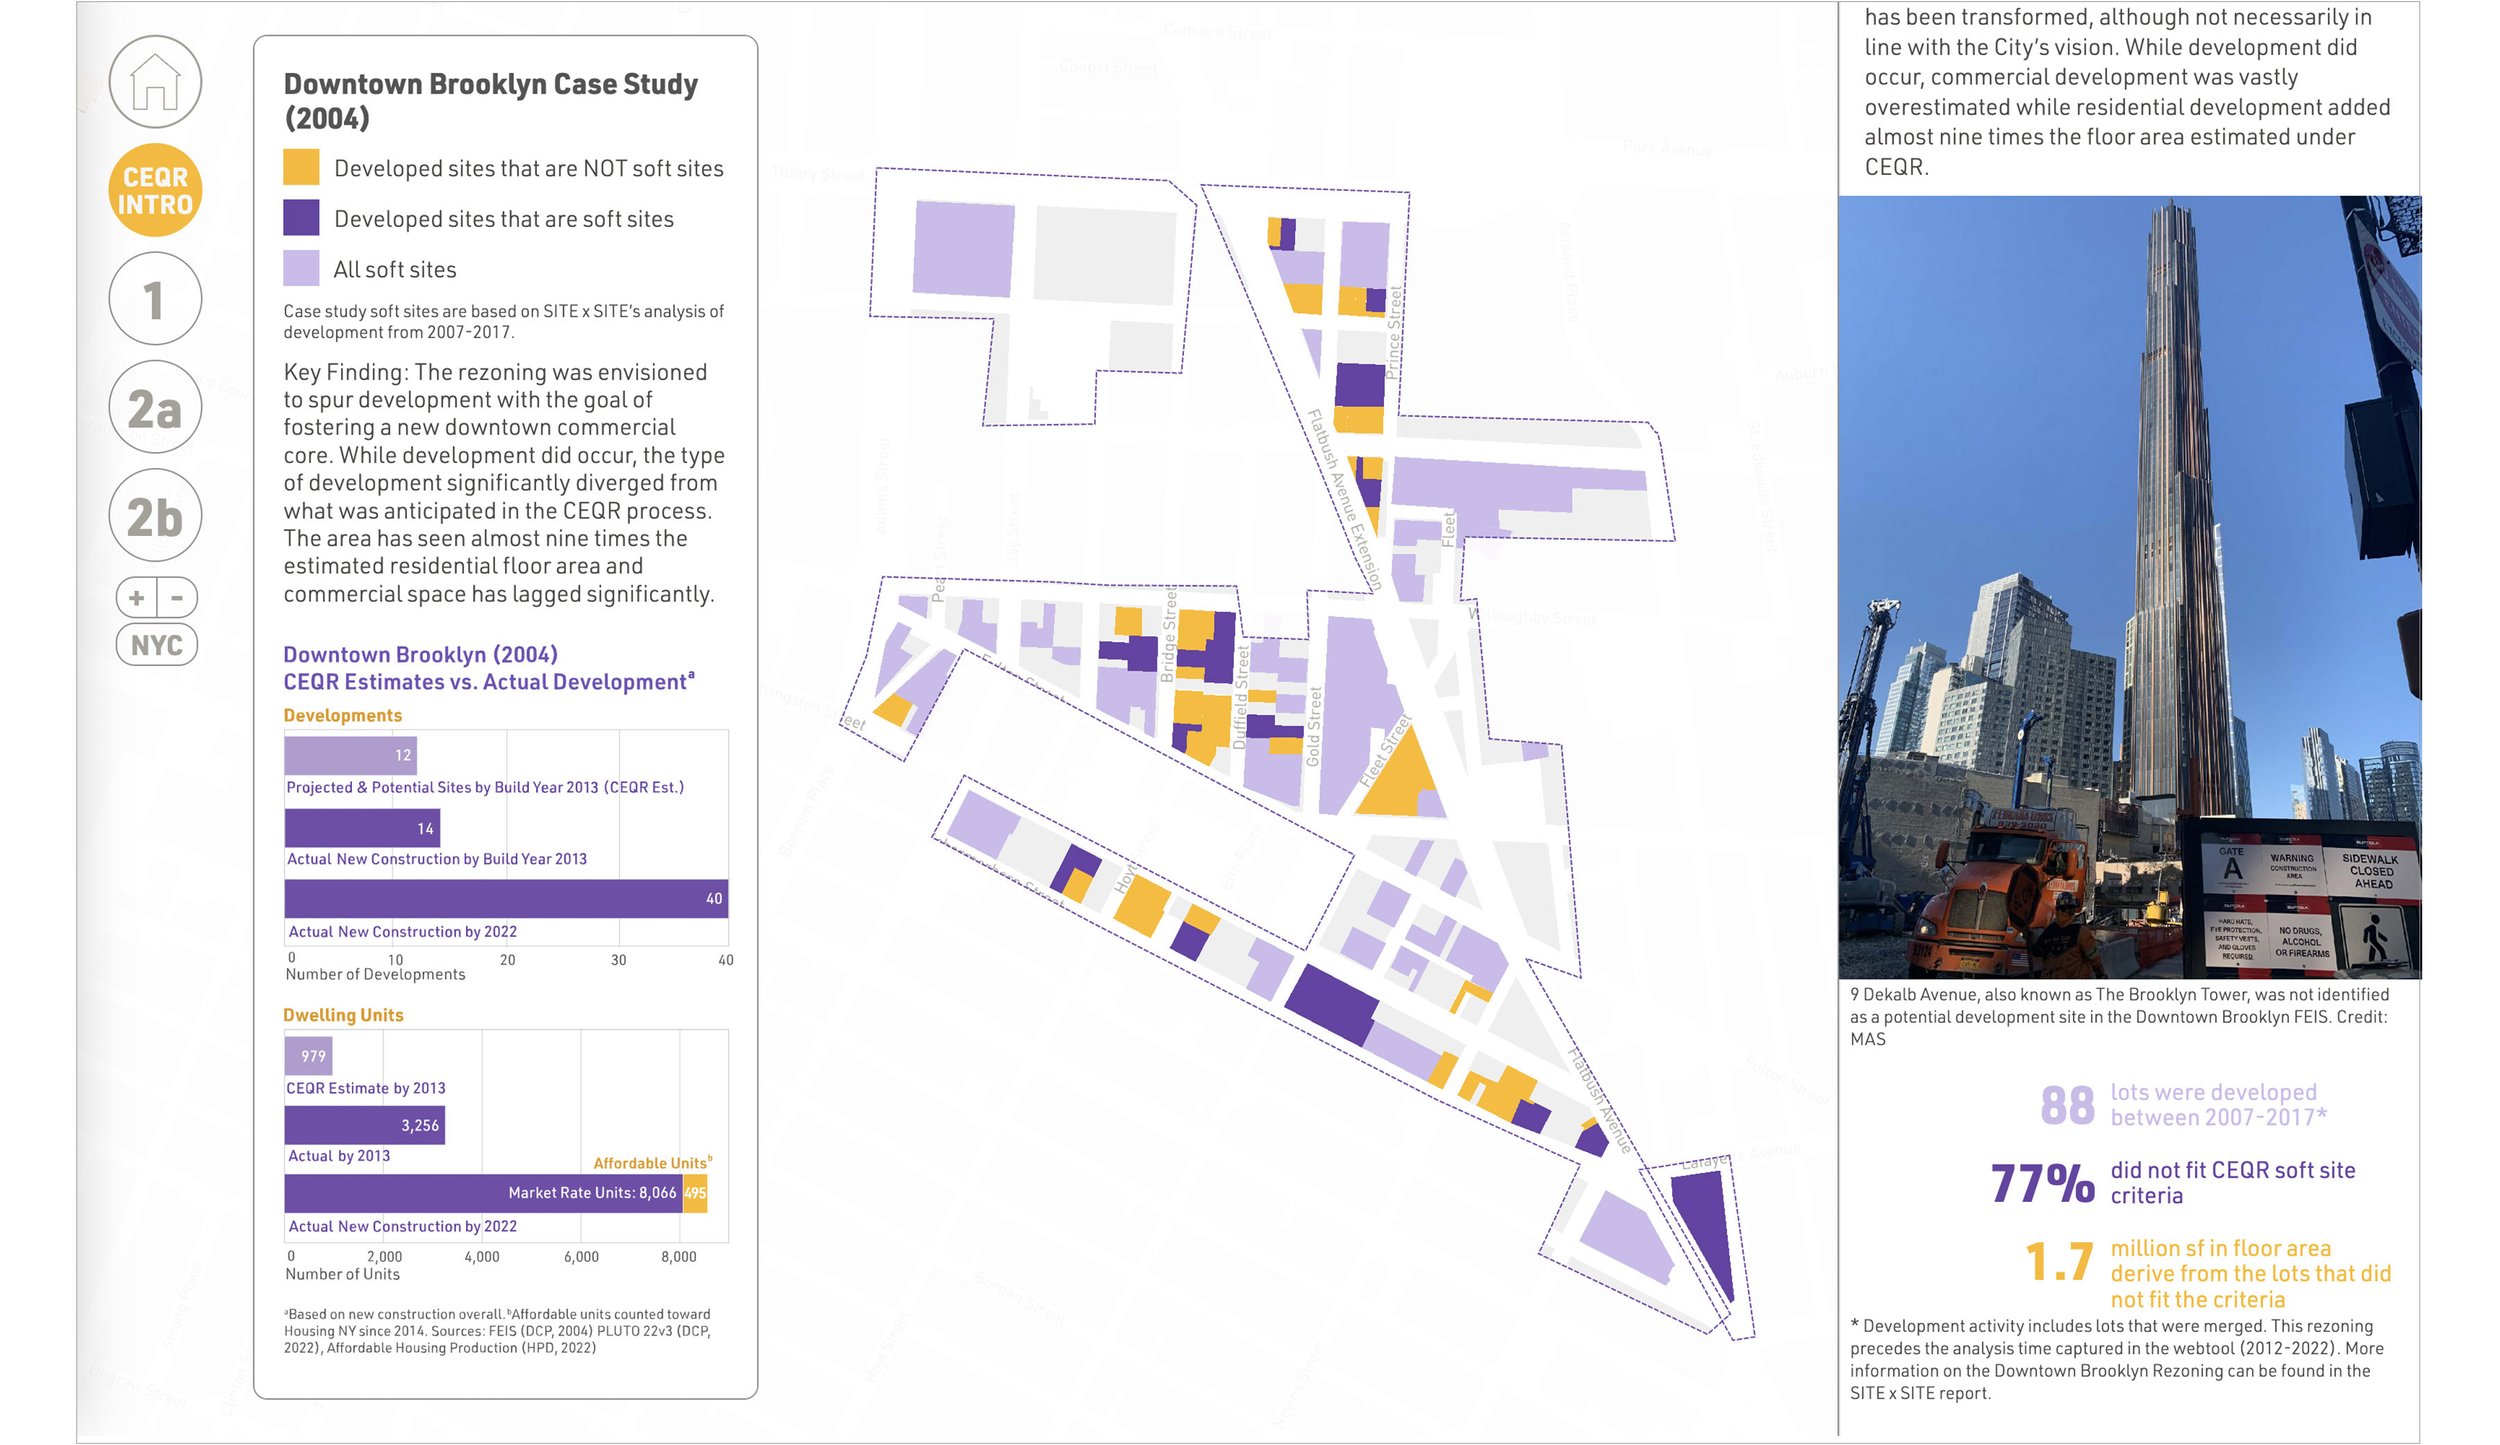
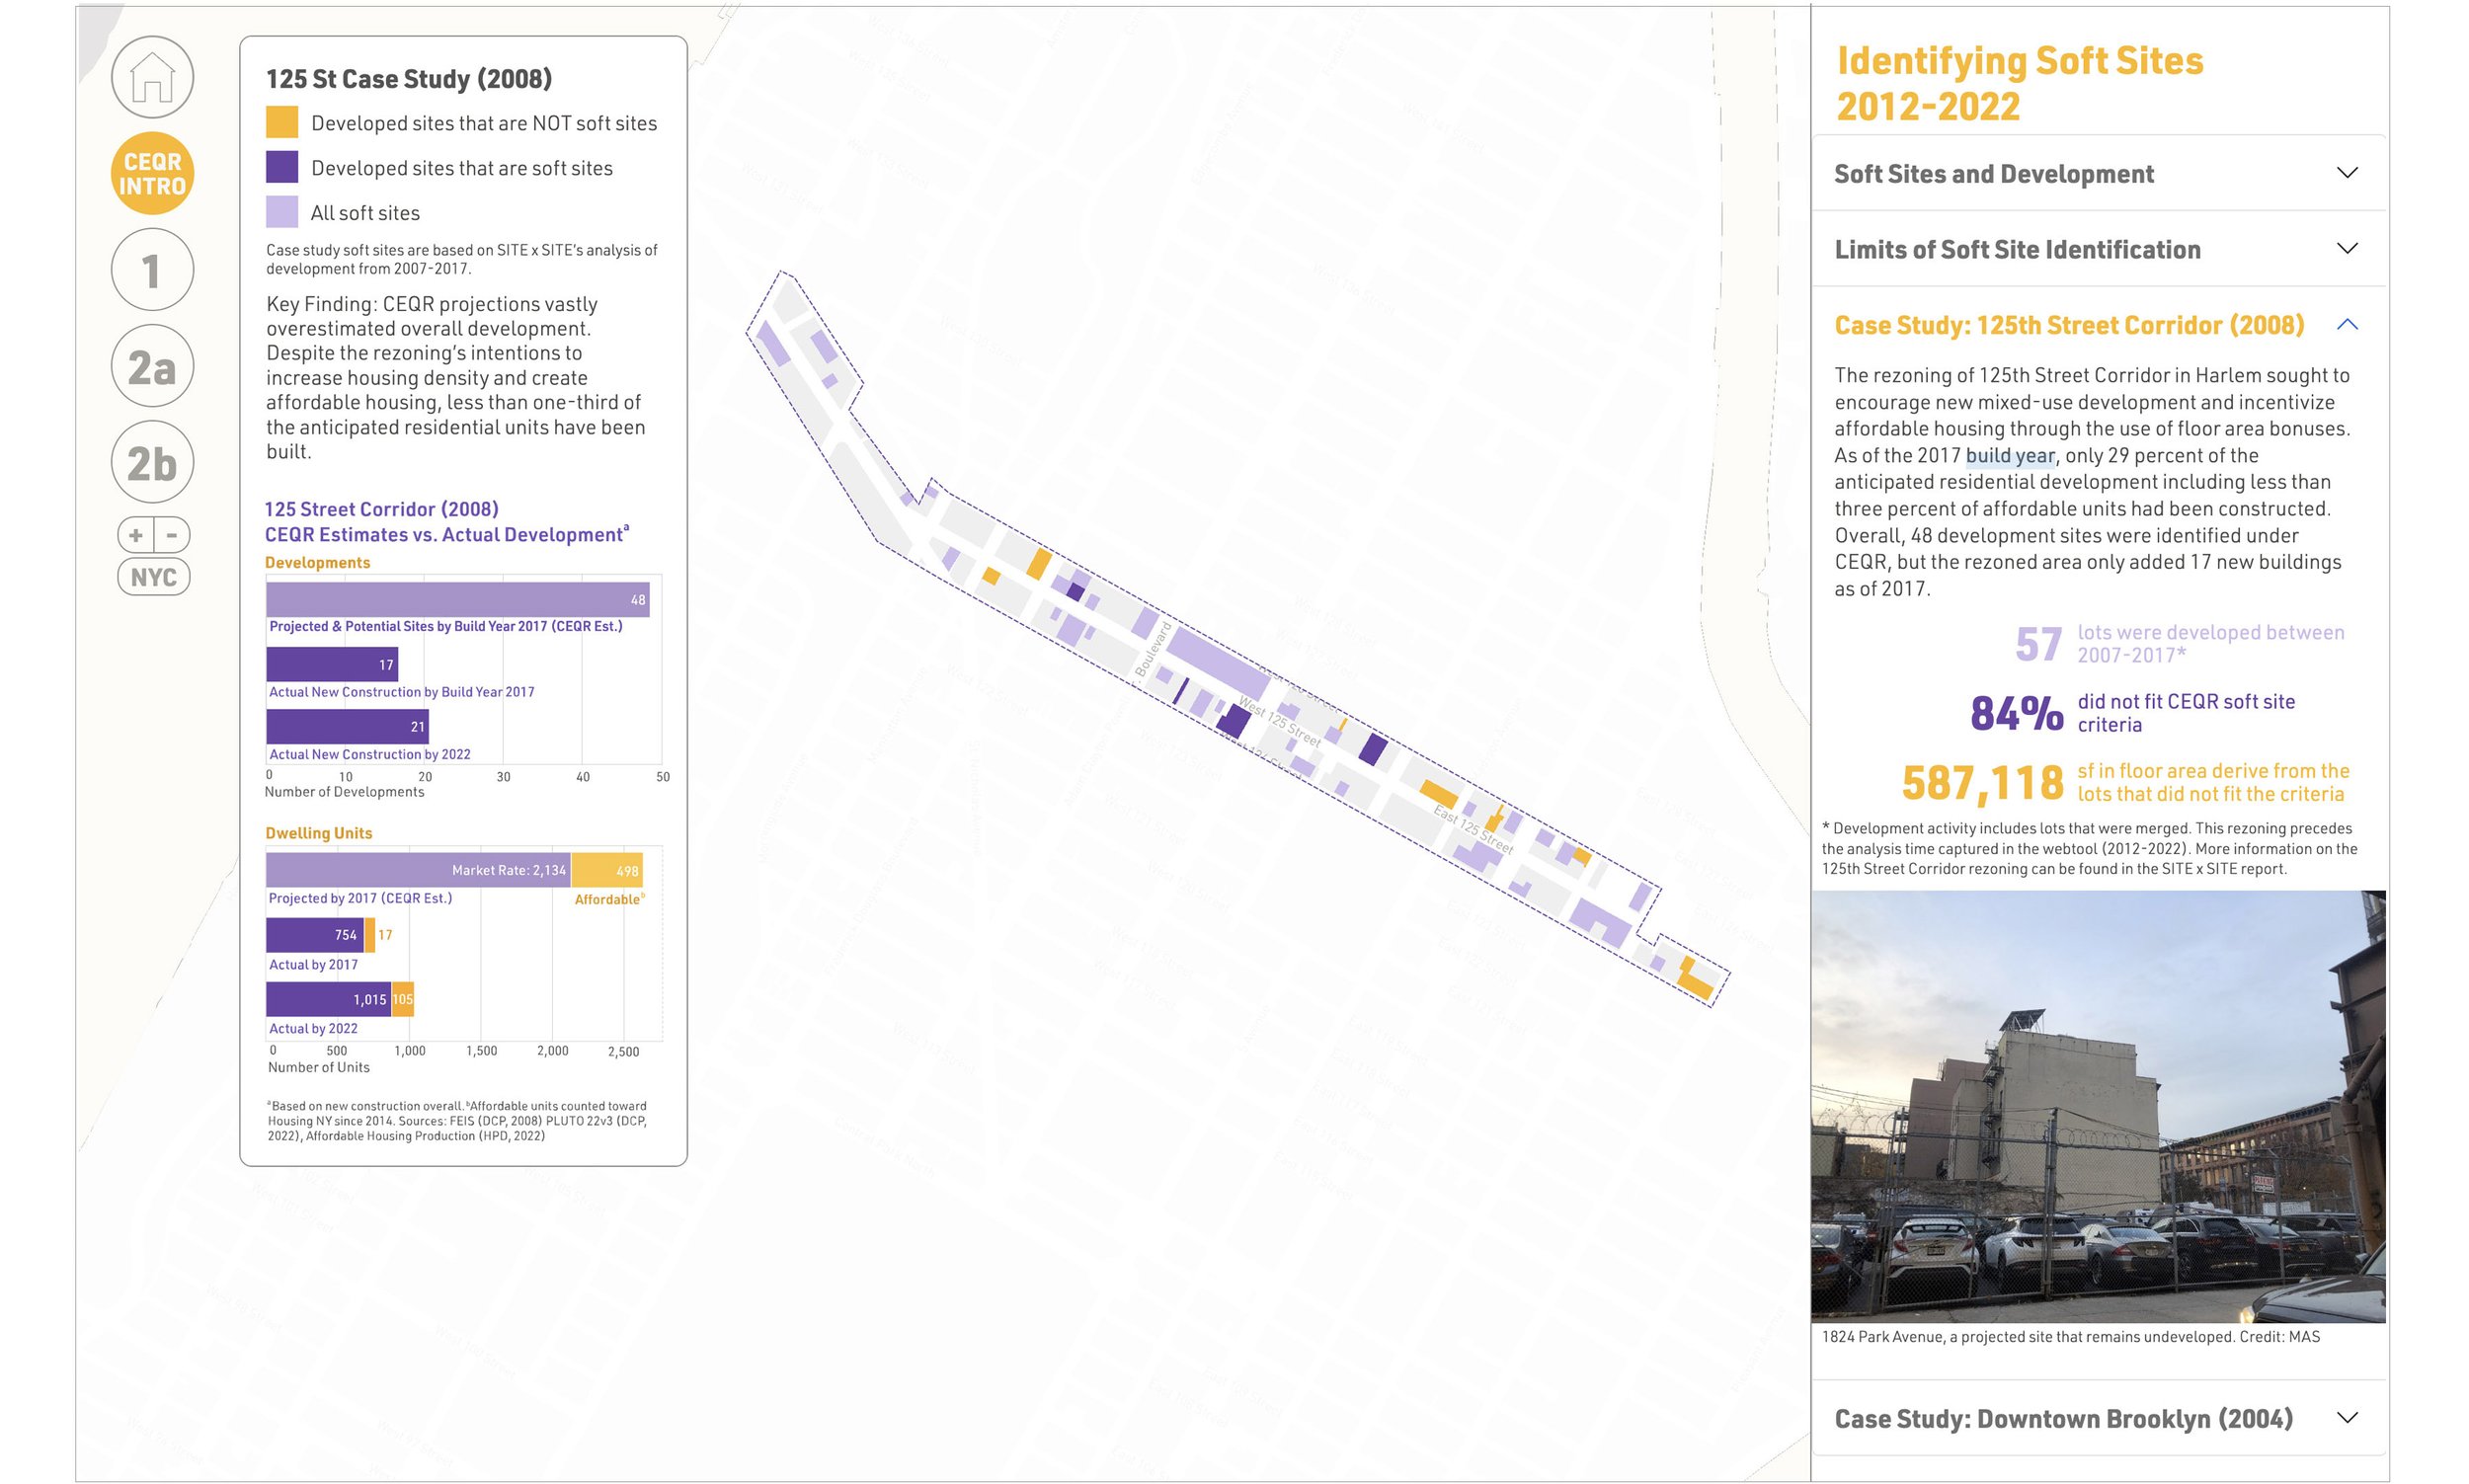
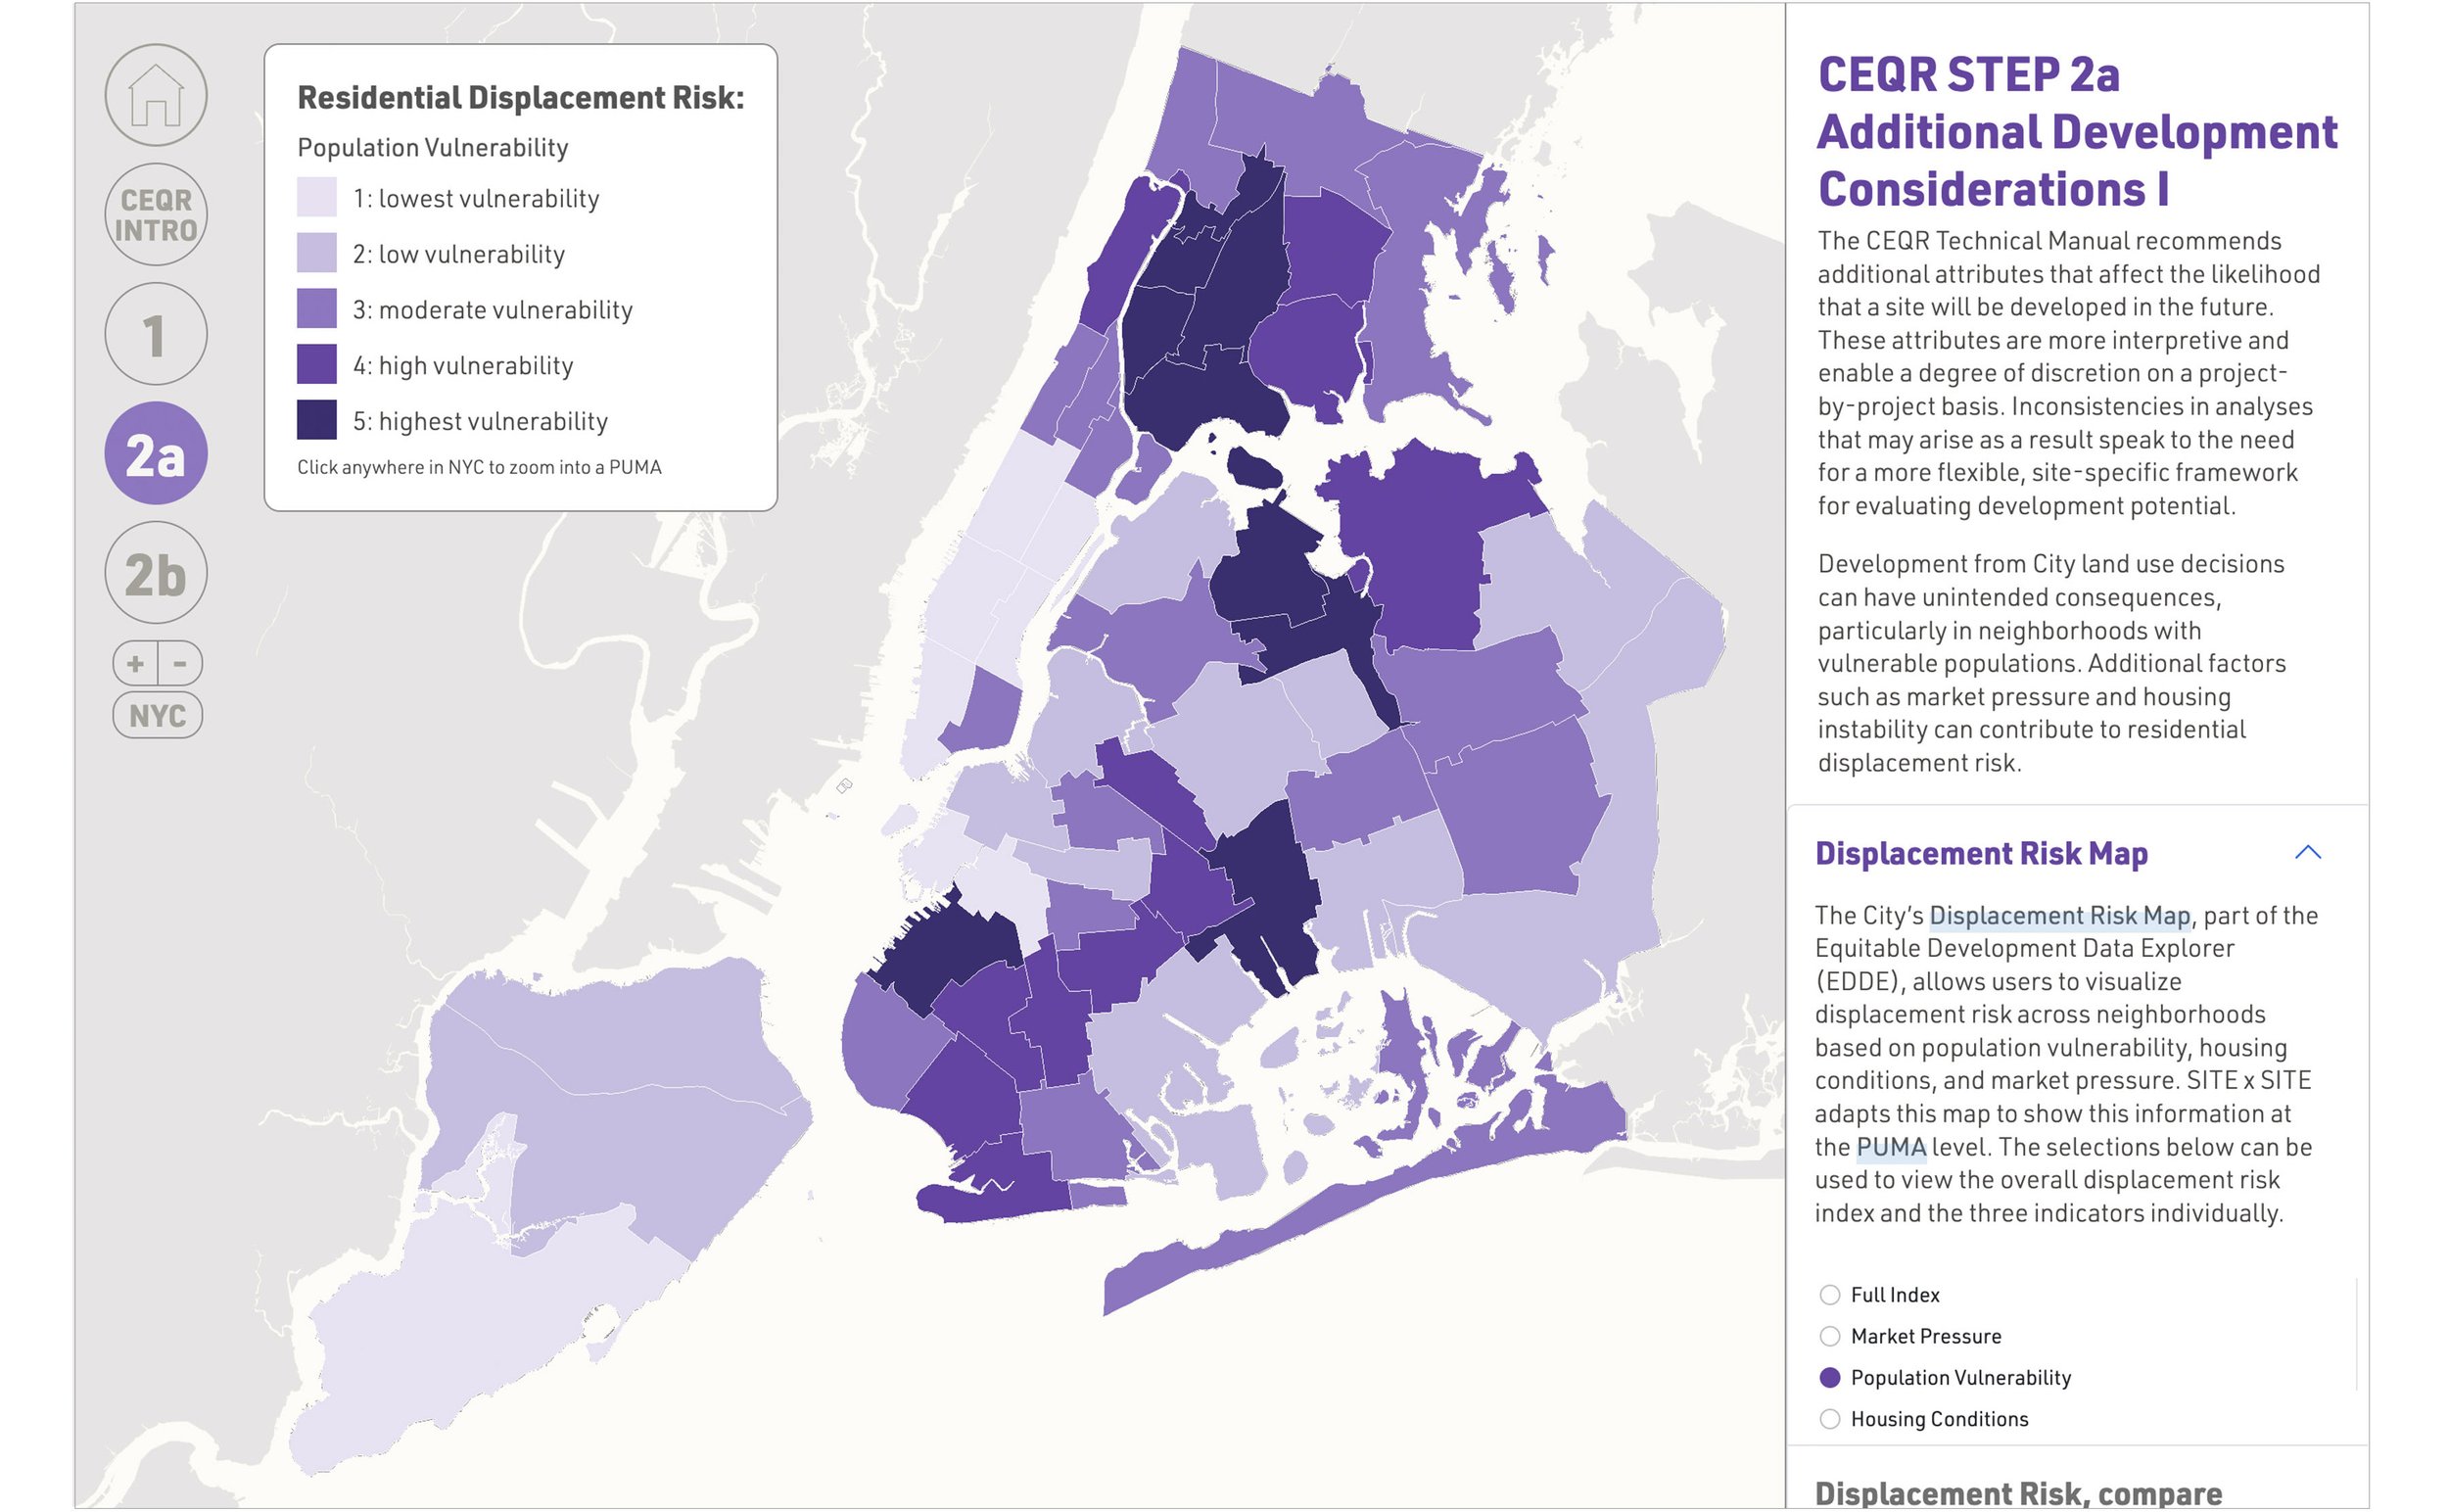
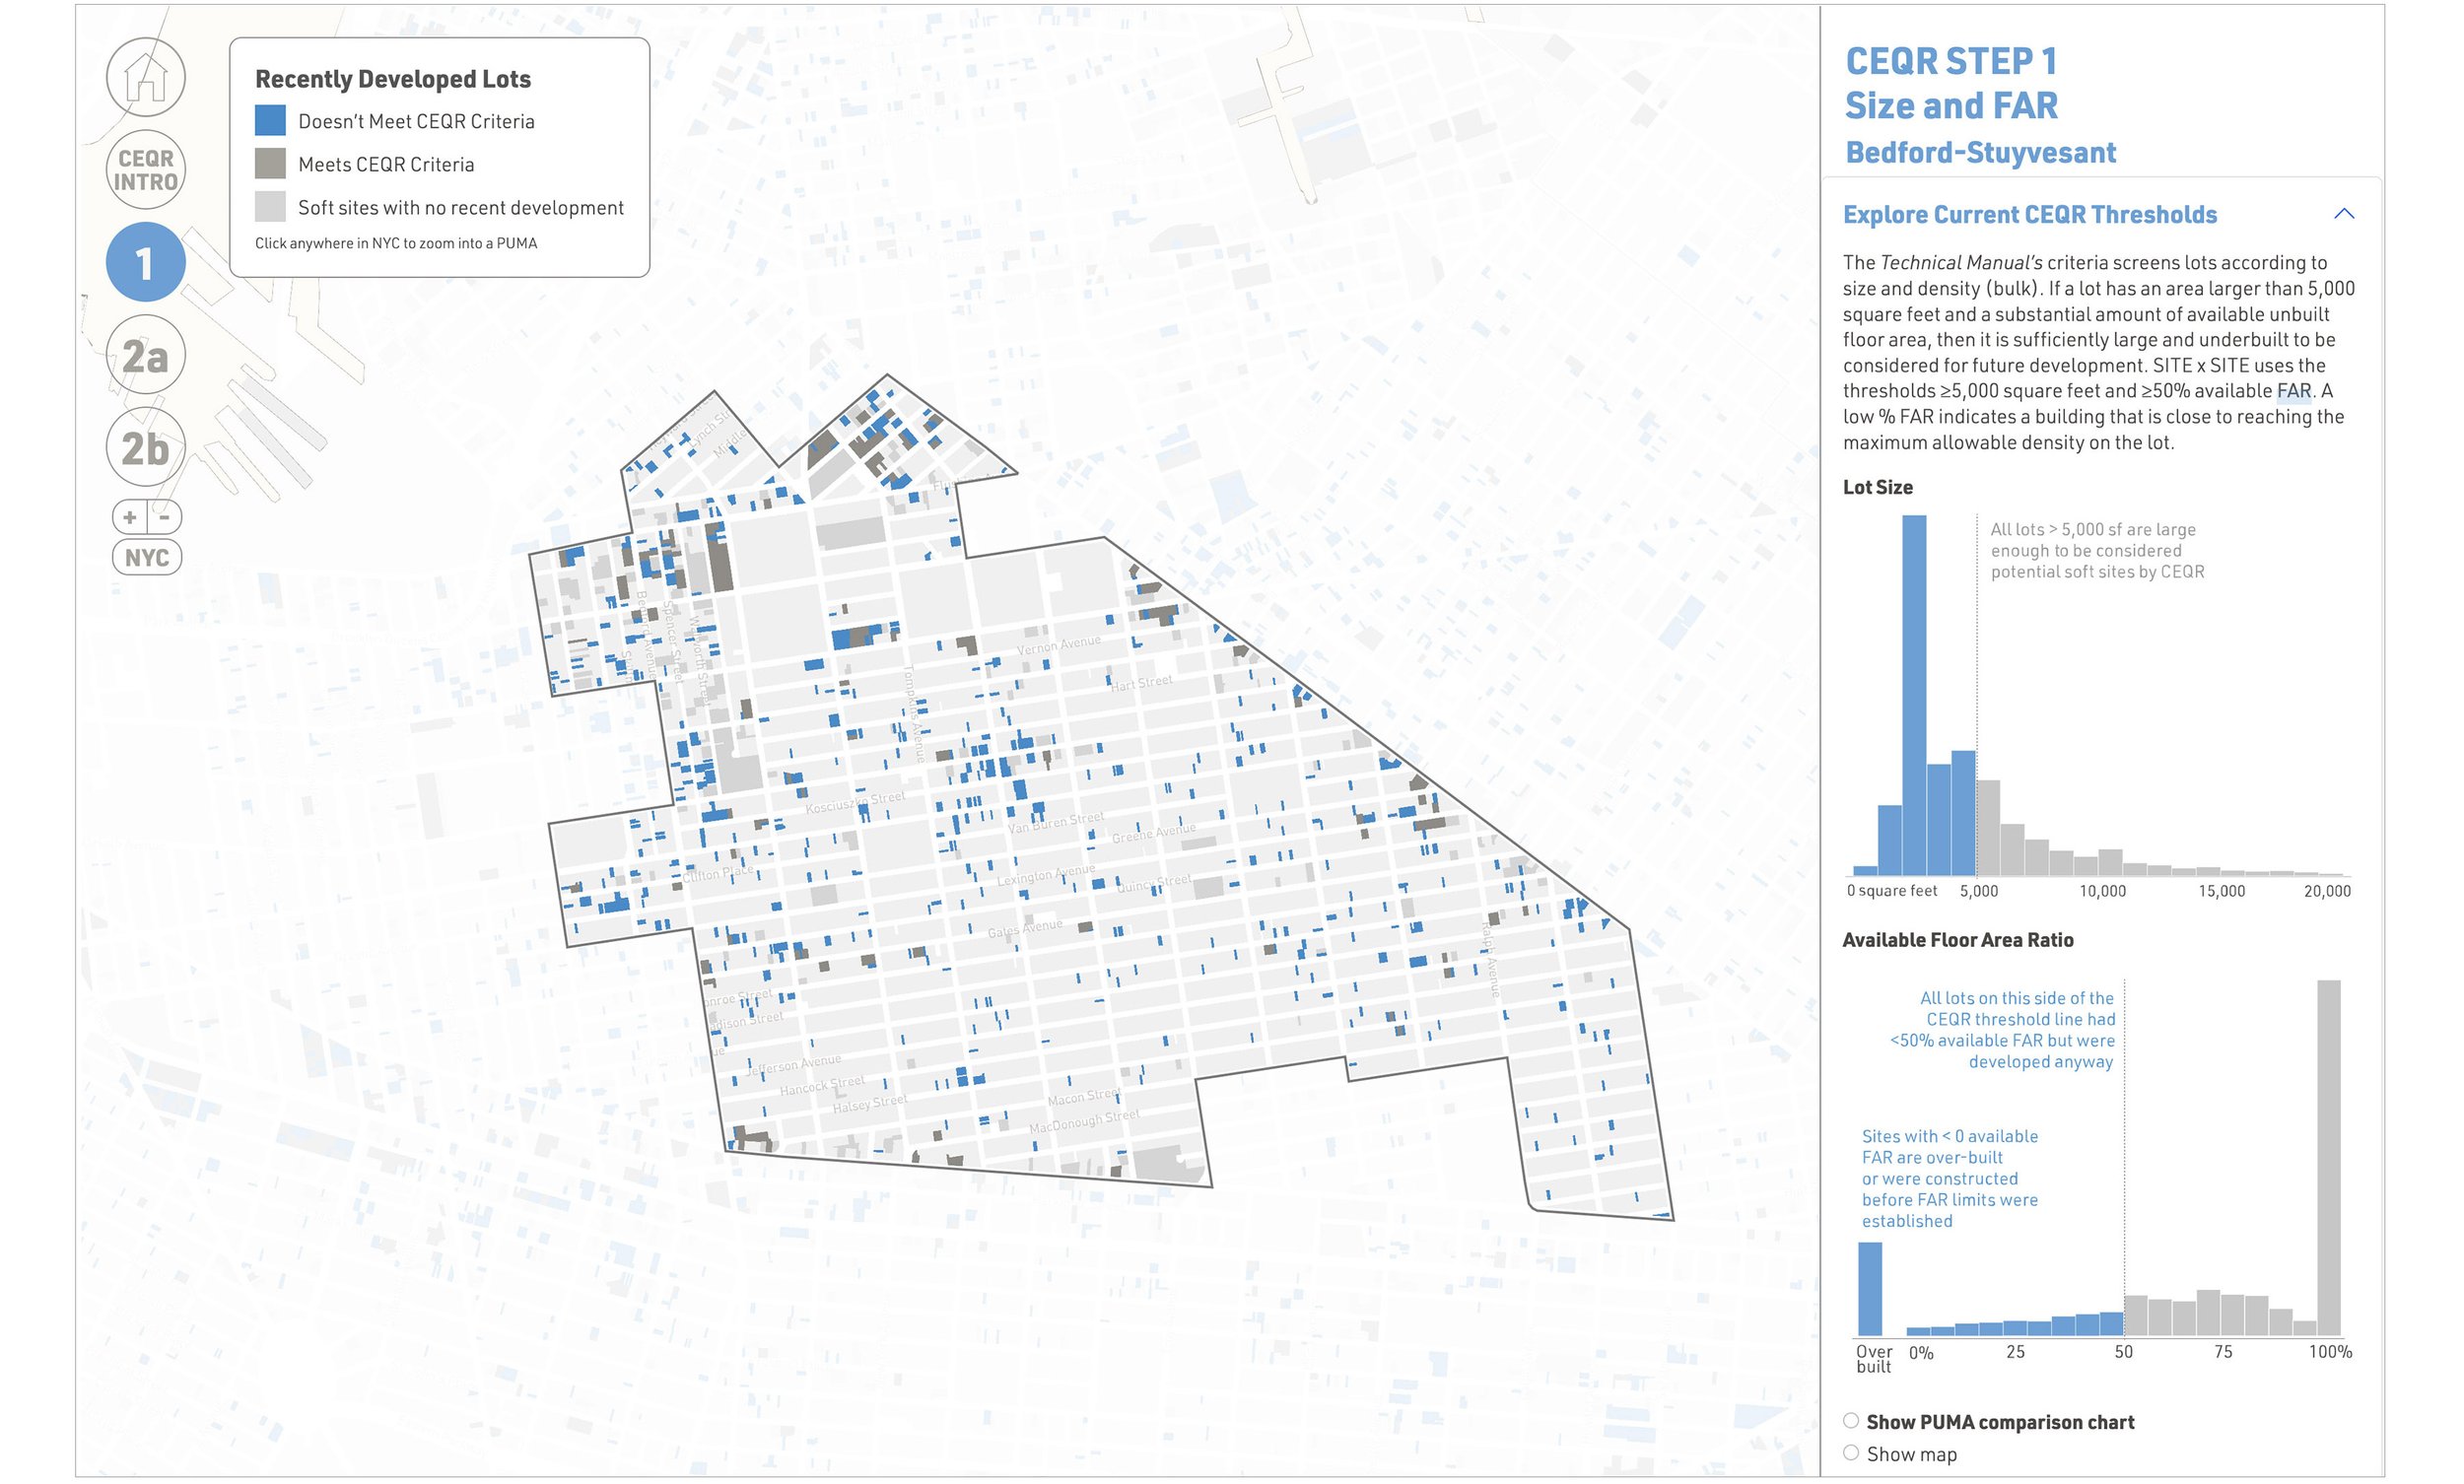
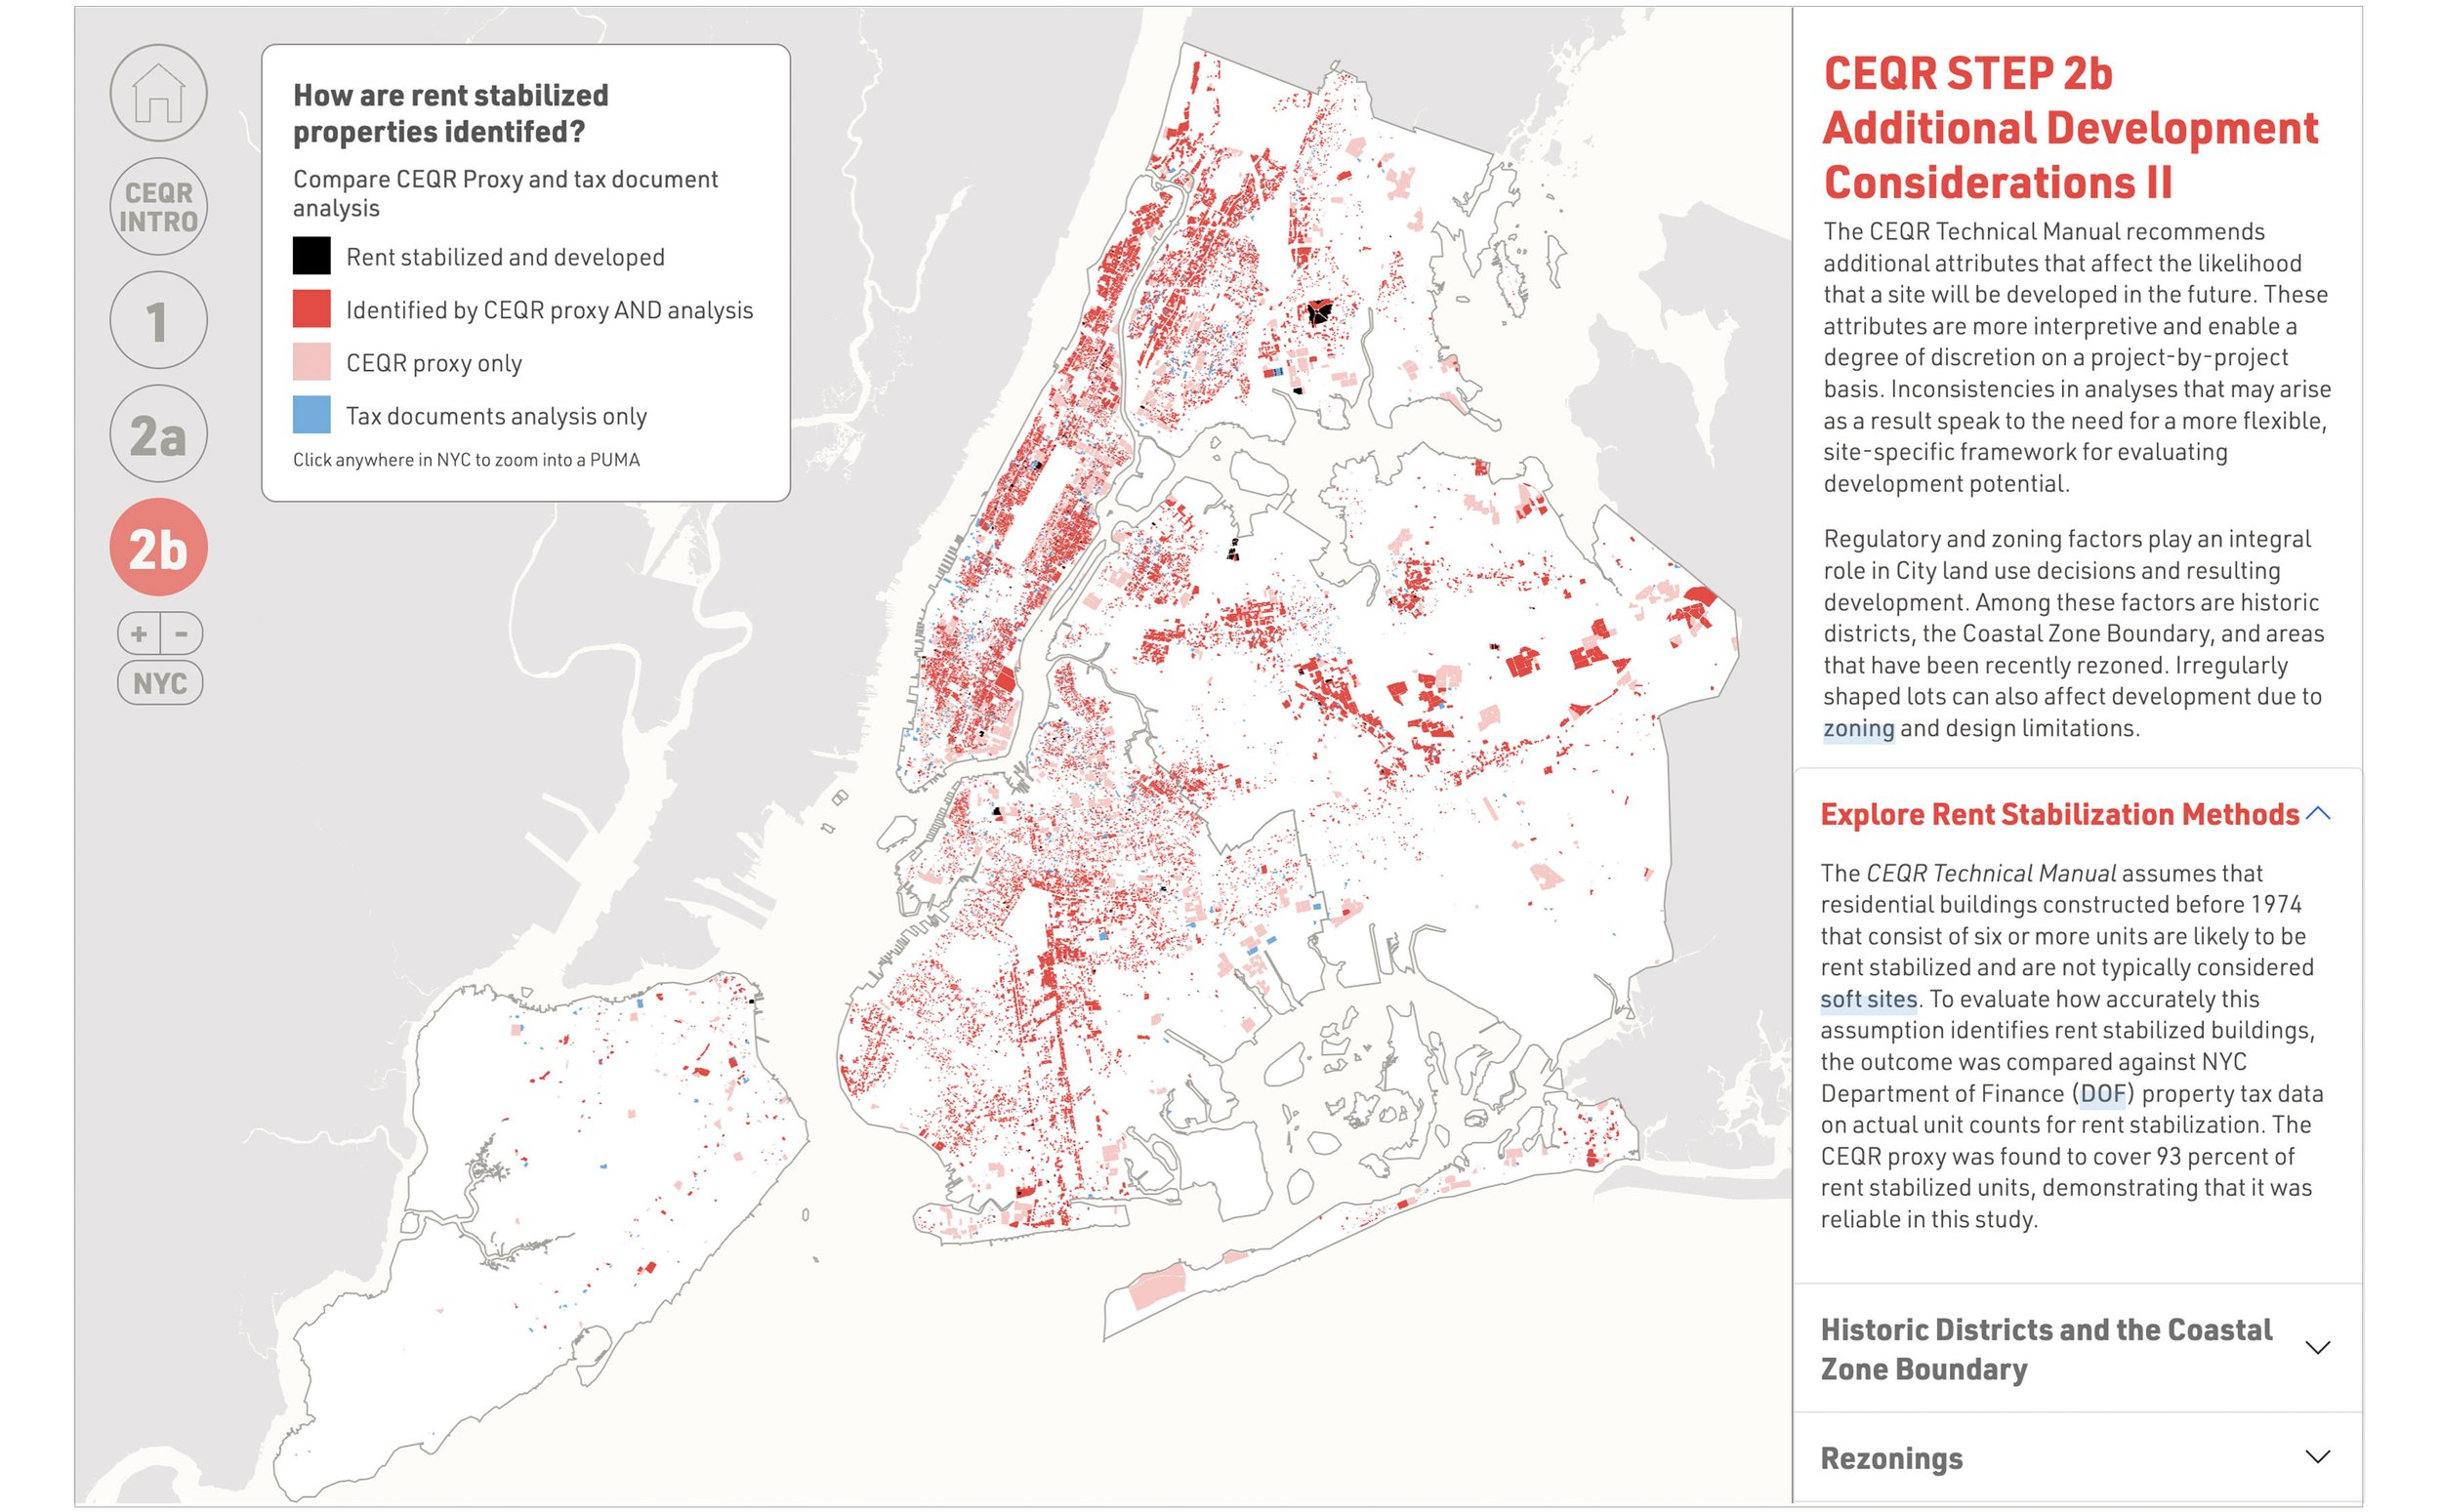
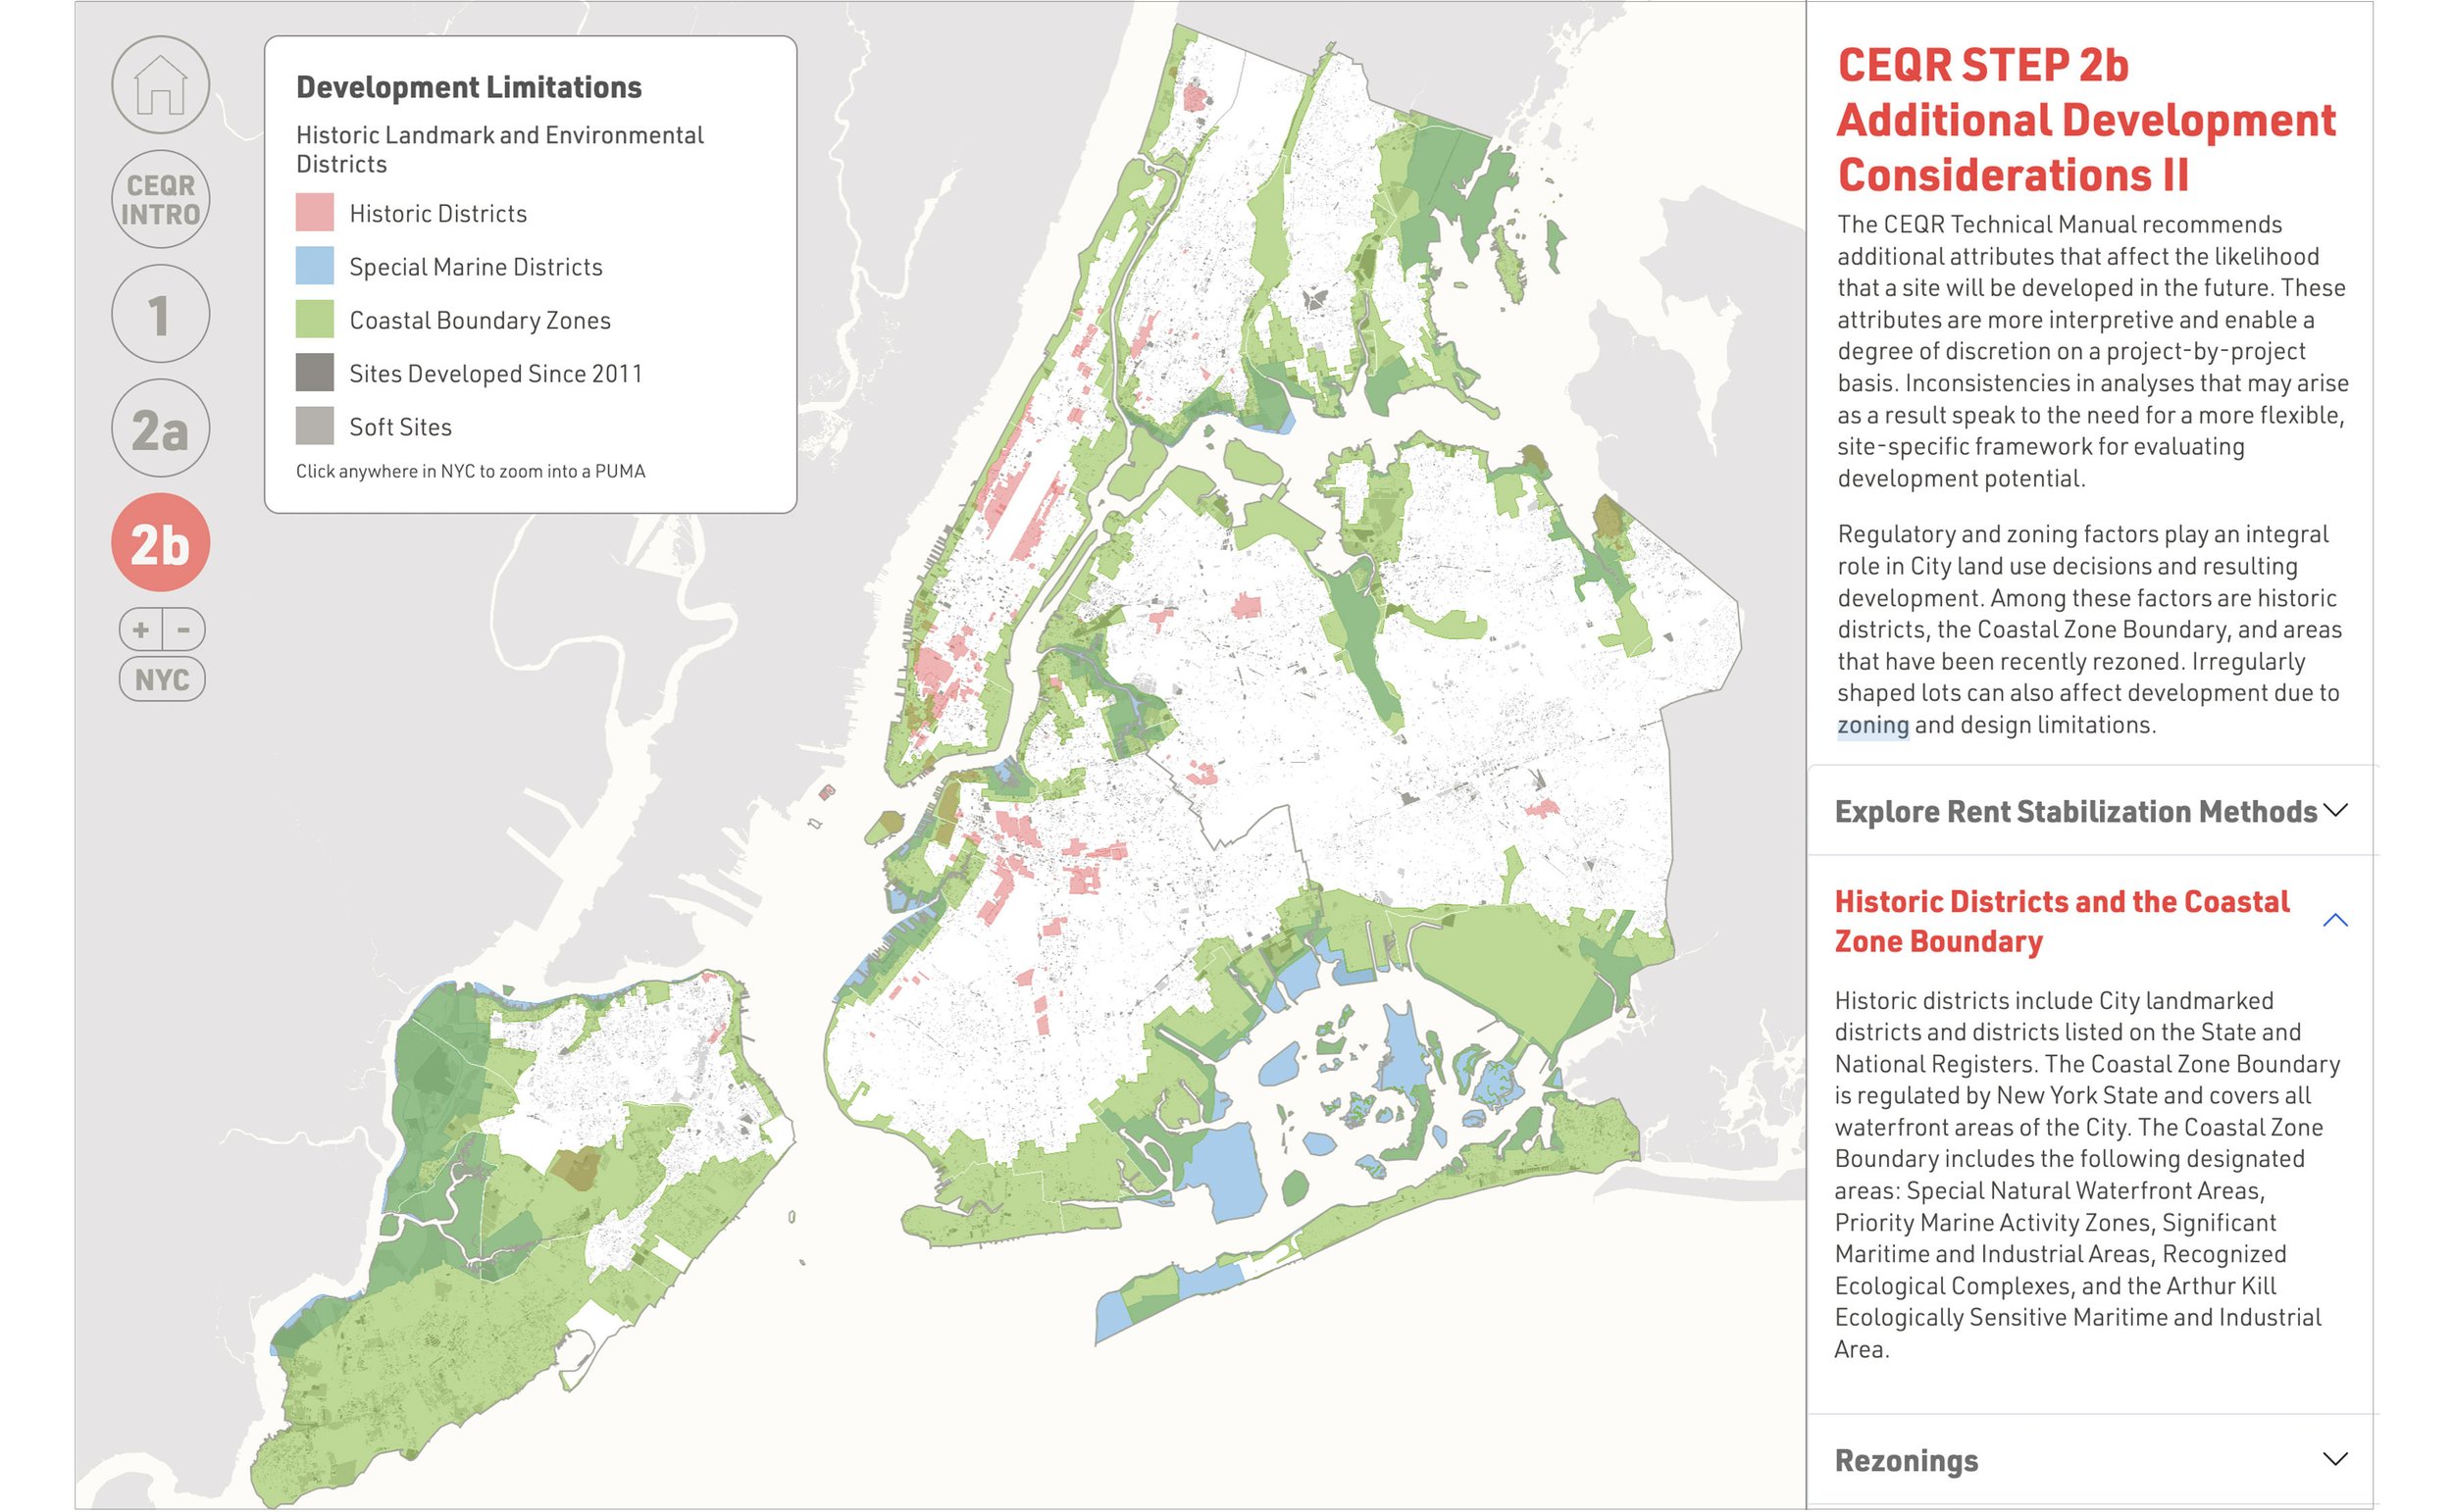
SITE x SITE is a study, analysis and website that illustrates limitations of the City Environmental Quality Review (CEQR). Using publicly available city data SITE x SITE looks back on the development of soft sites in order to evaluate where the CEQR process could be better.
I worked for 18 months on SITE X SITE with a team from the Municipal Arts Society and the Regional Plan Association. I also worked with Can Sucuoglu at Pratt SAVI to start on this project, then with Sara Hodges for the second half. I took over management of the project half way through the project and did the data analysis for a look at development from 2012-2022 for the website. I then created a comprehensive design for the website and data visualizations.


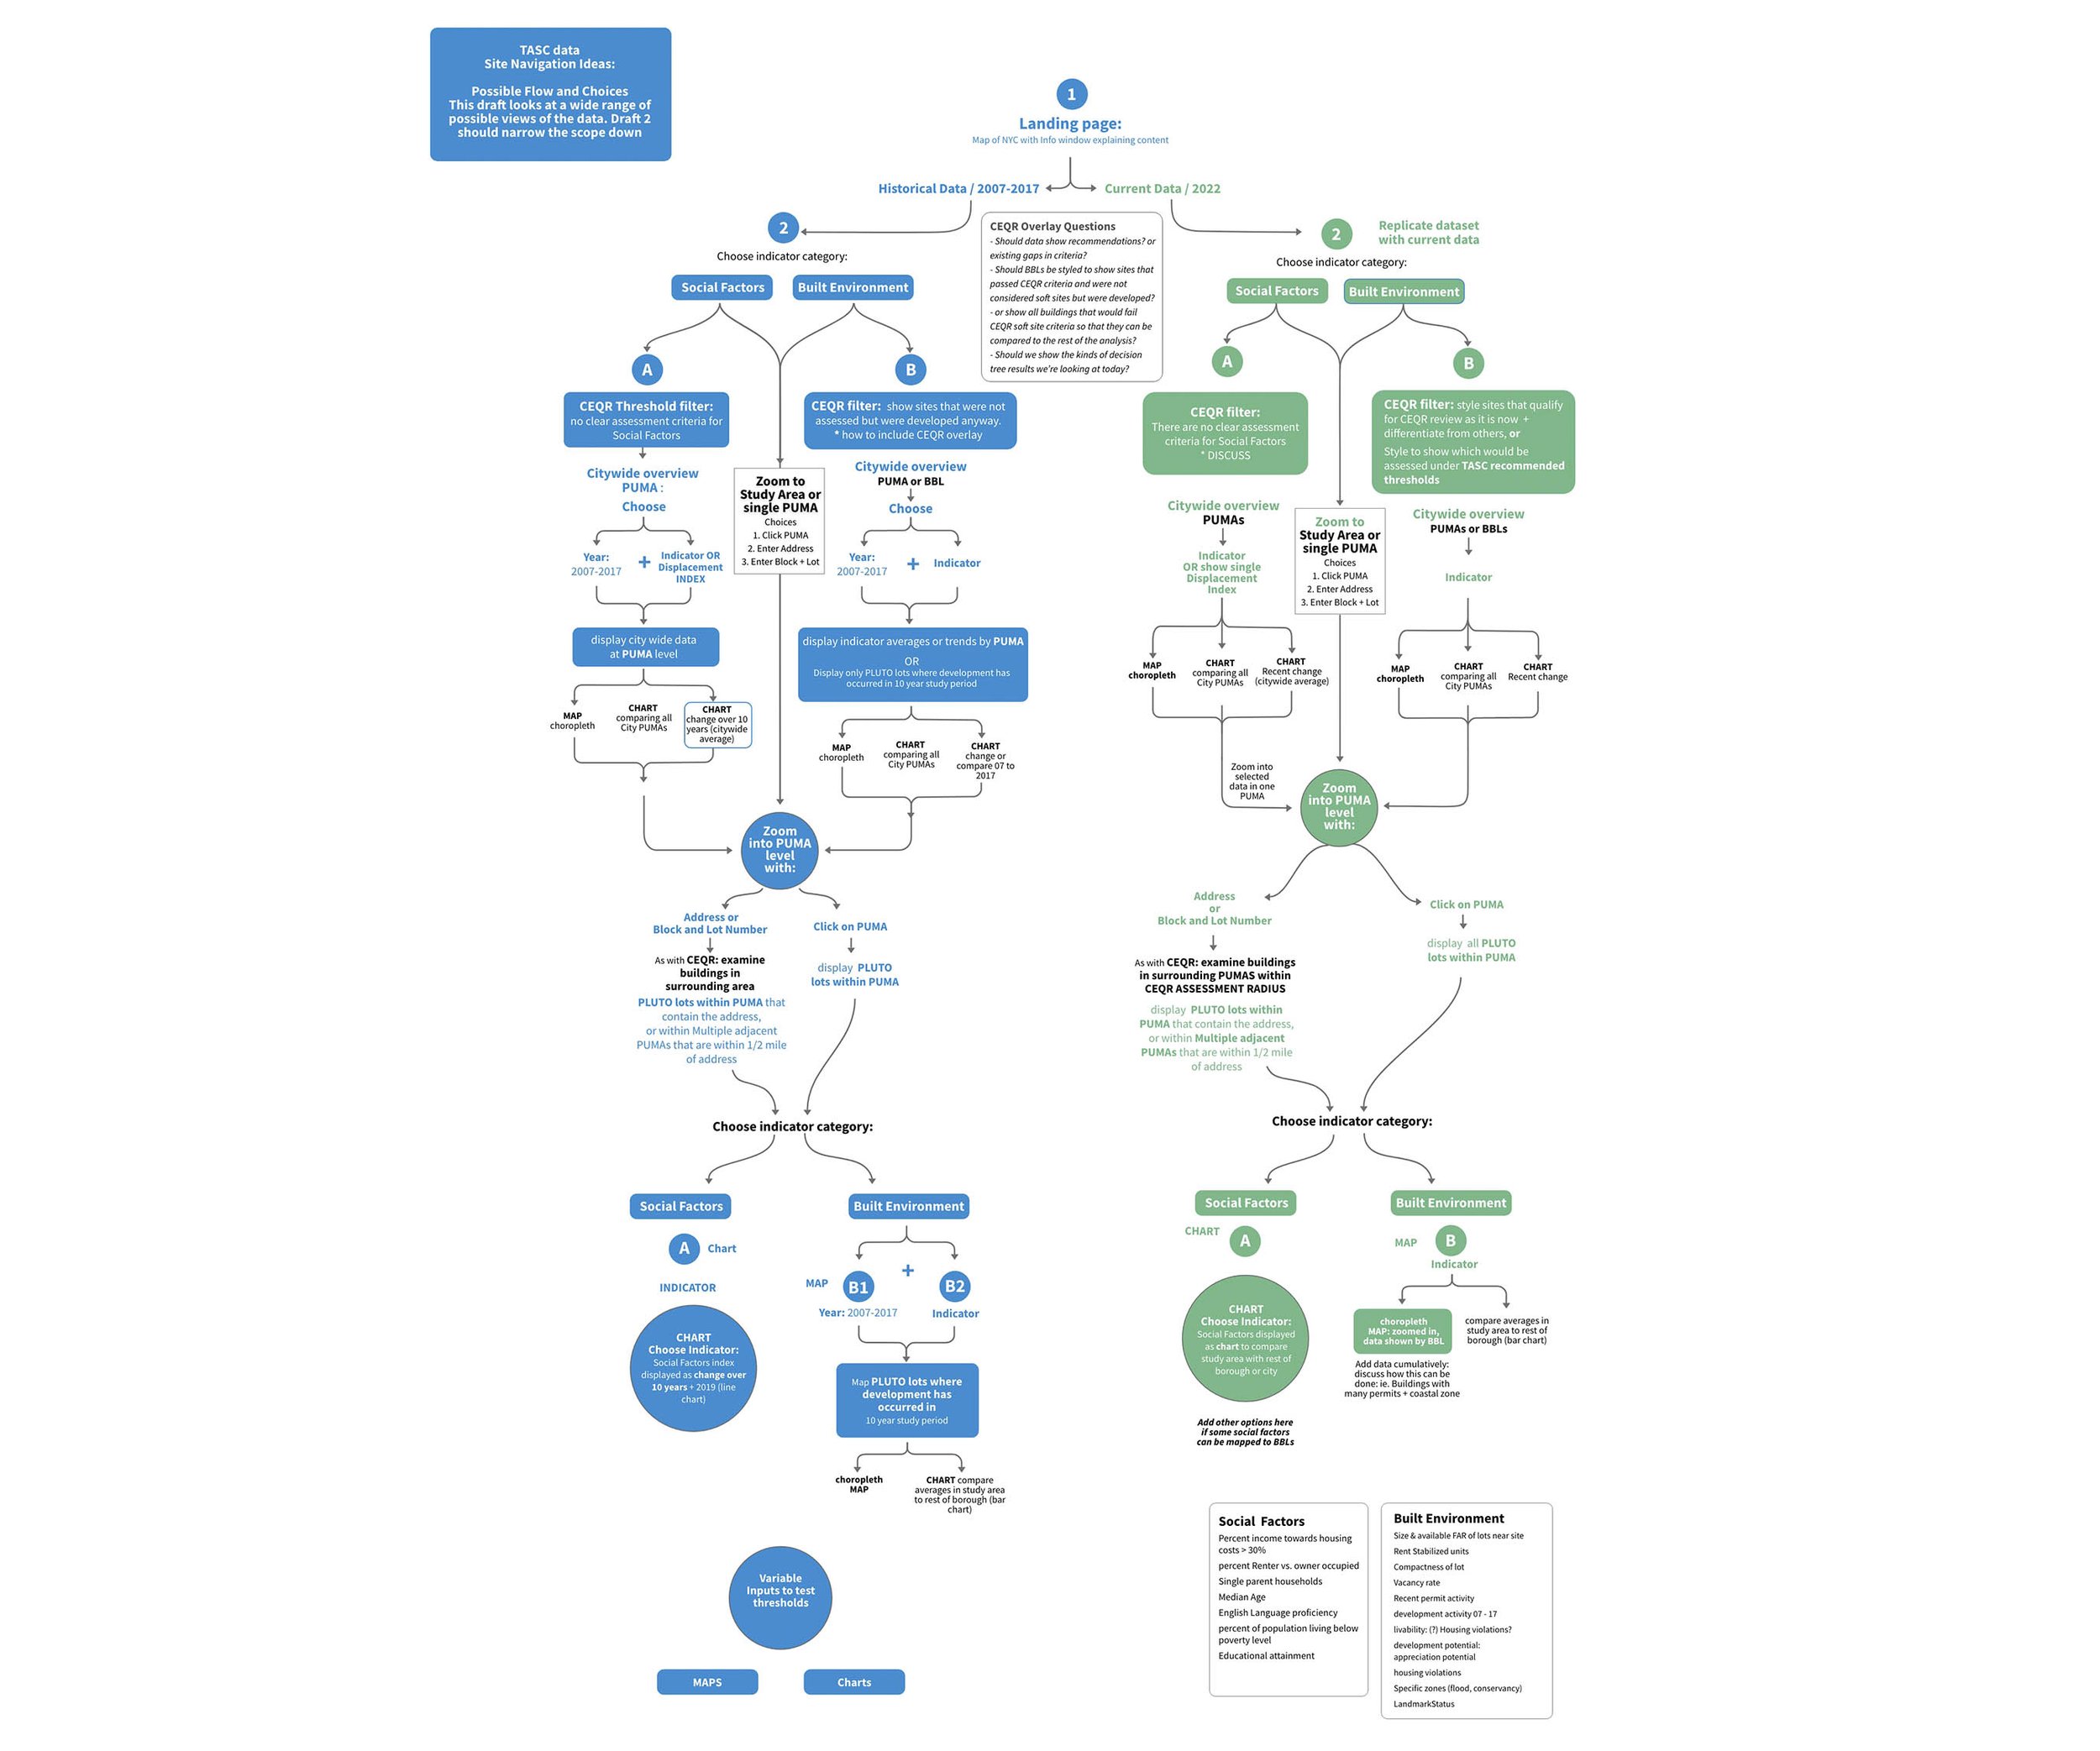
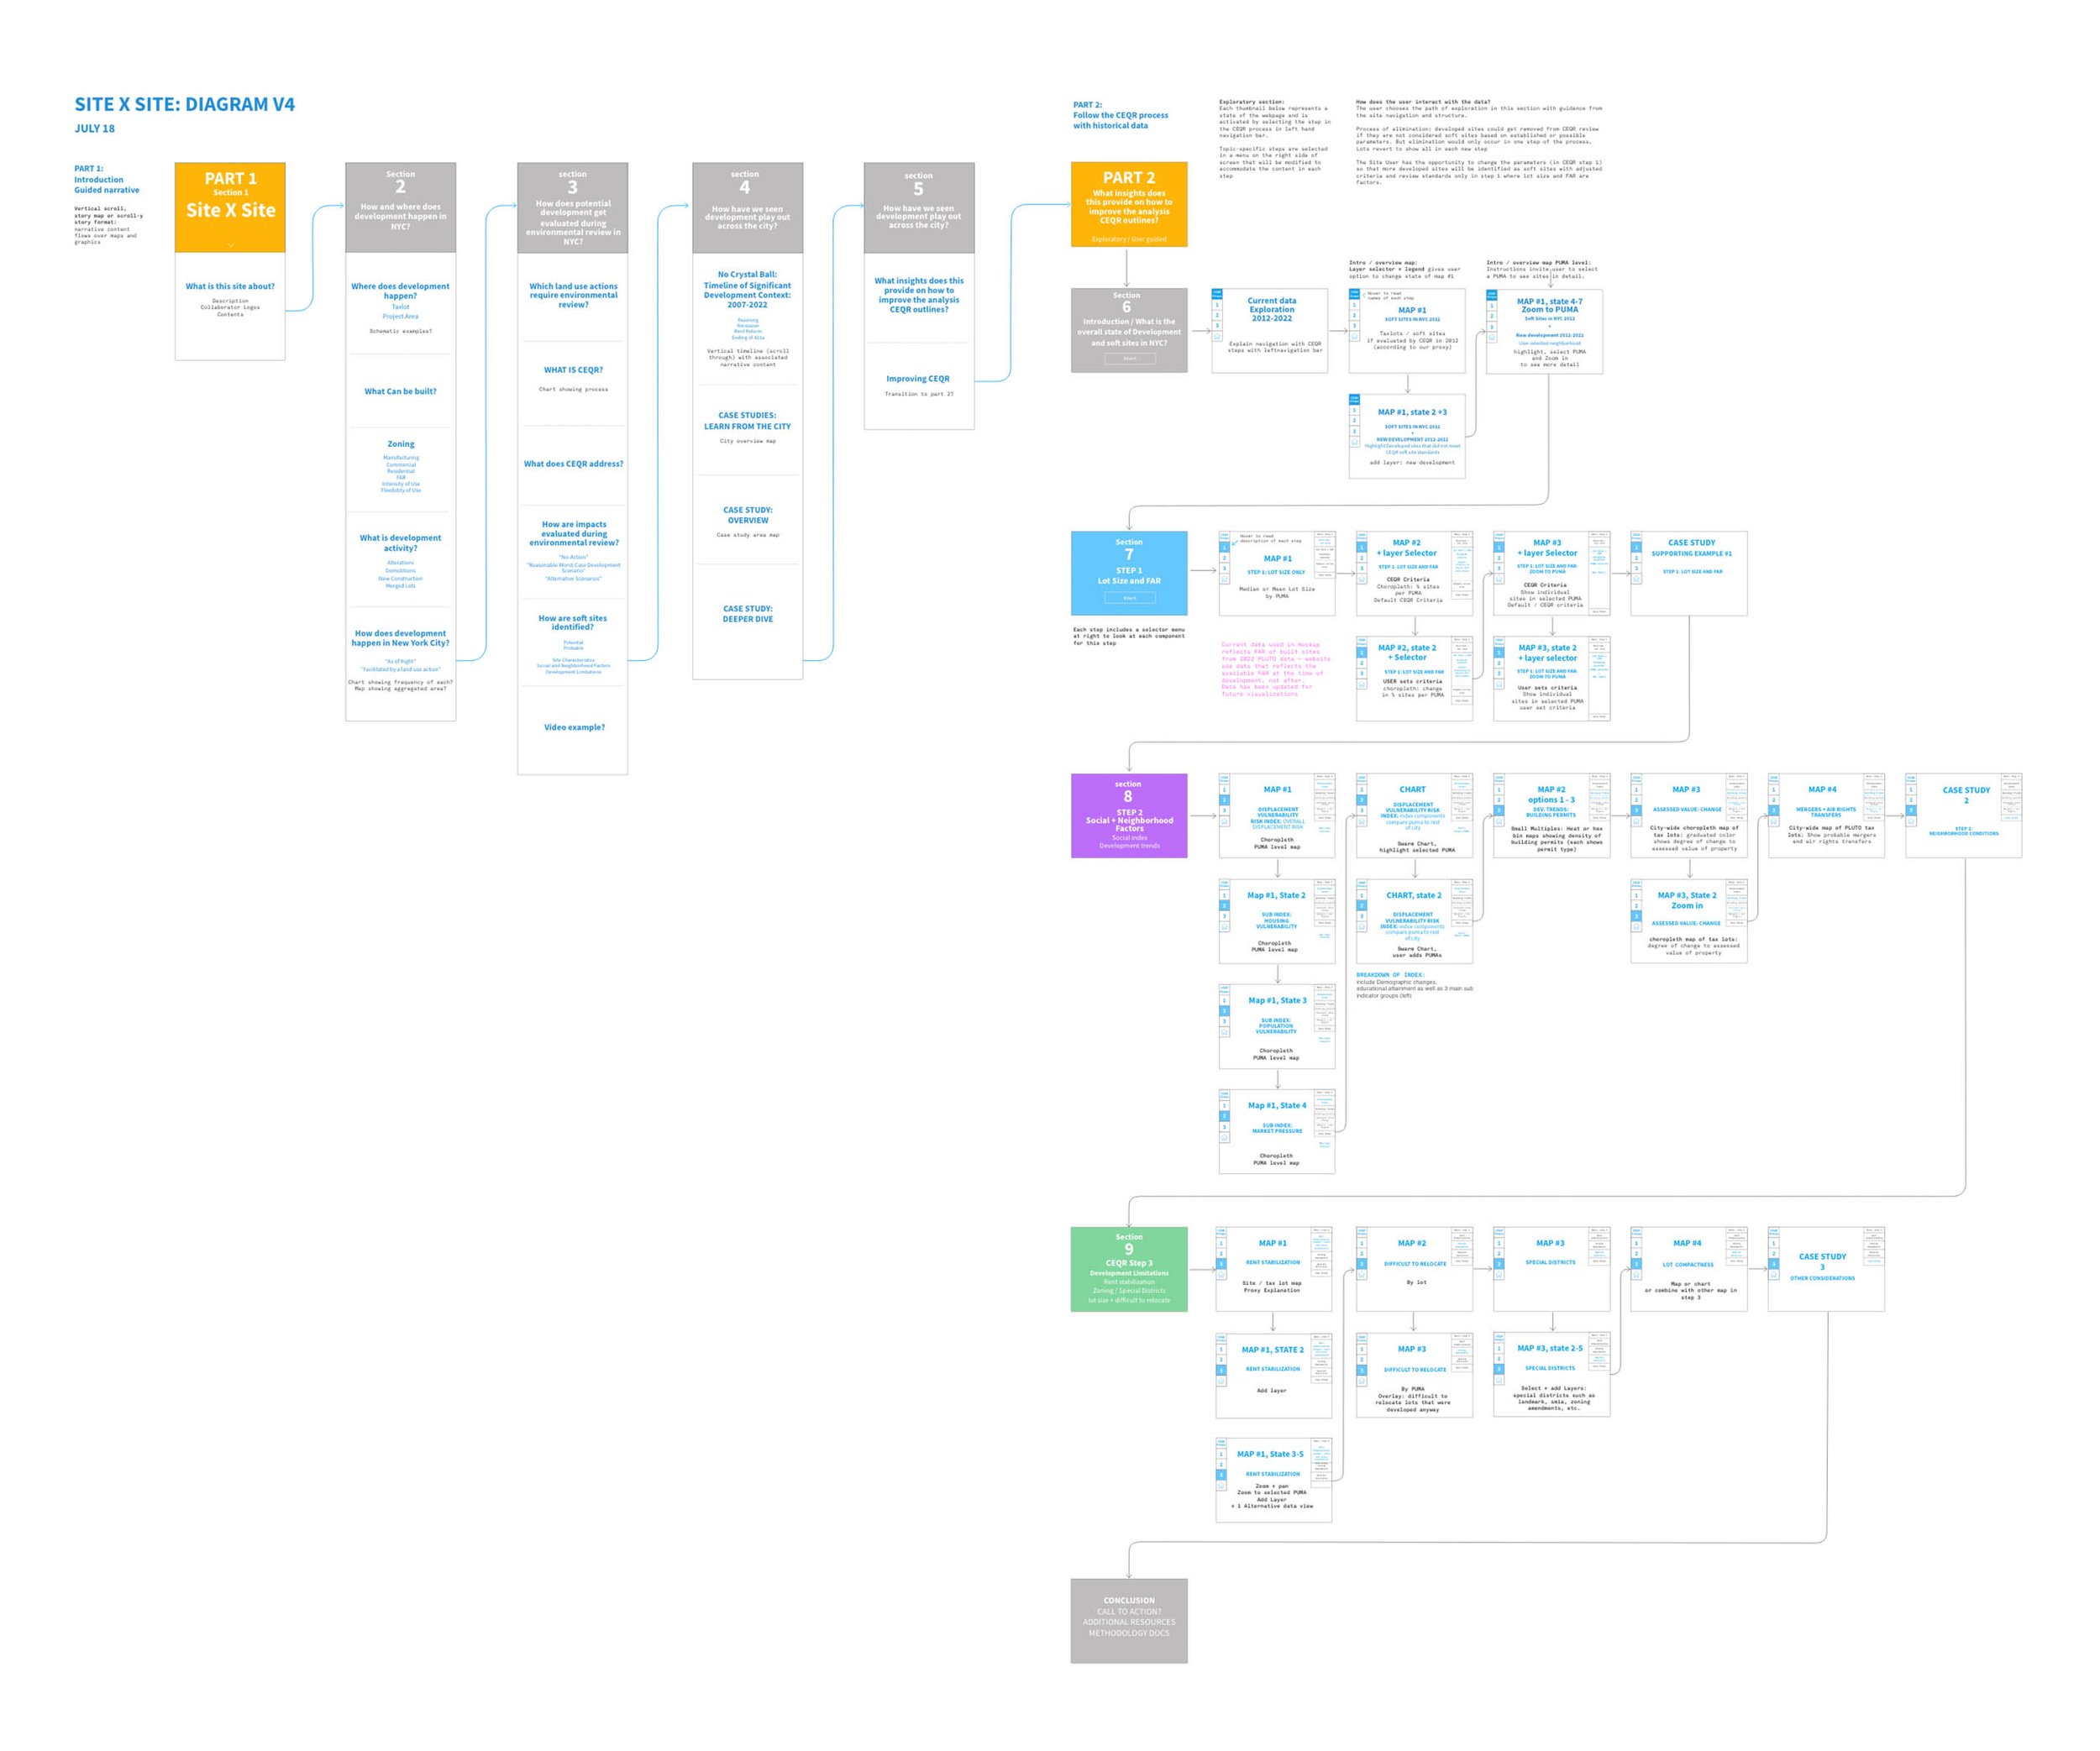
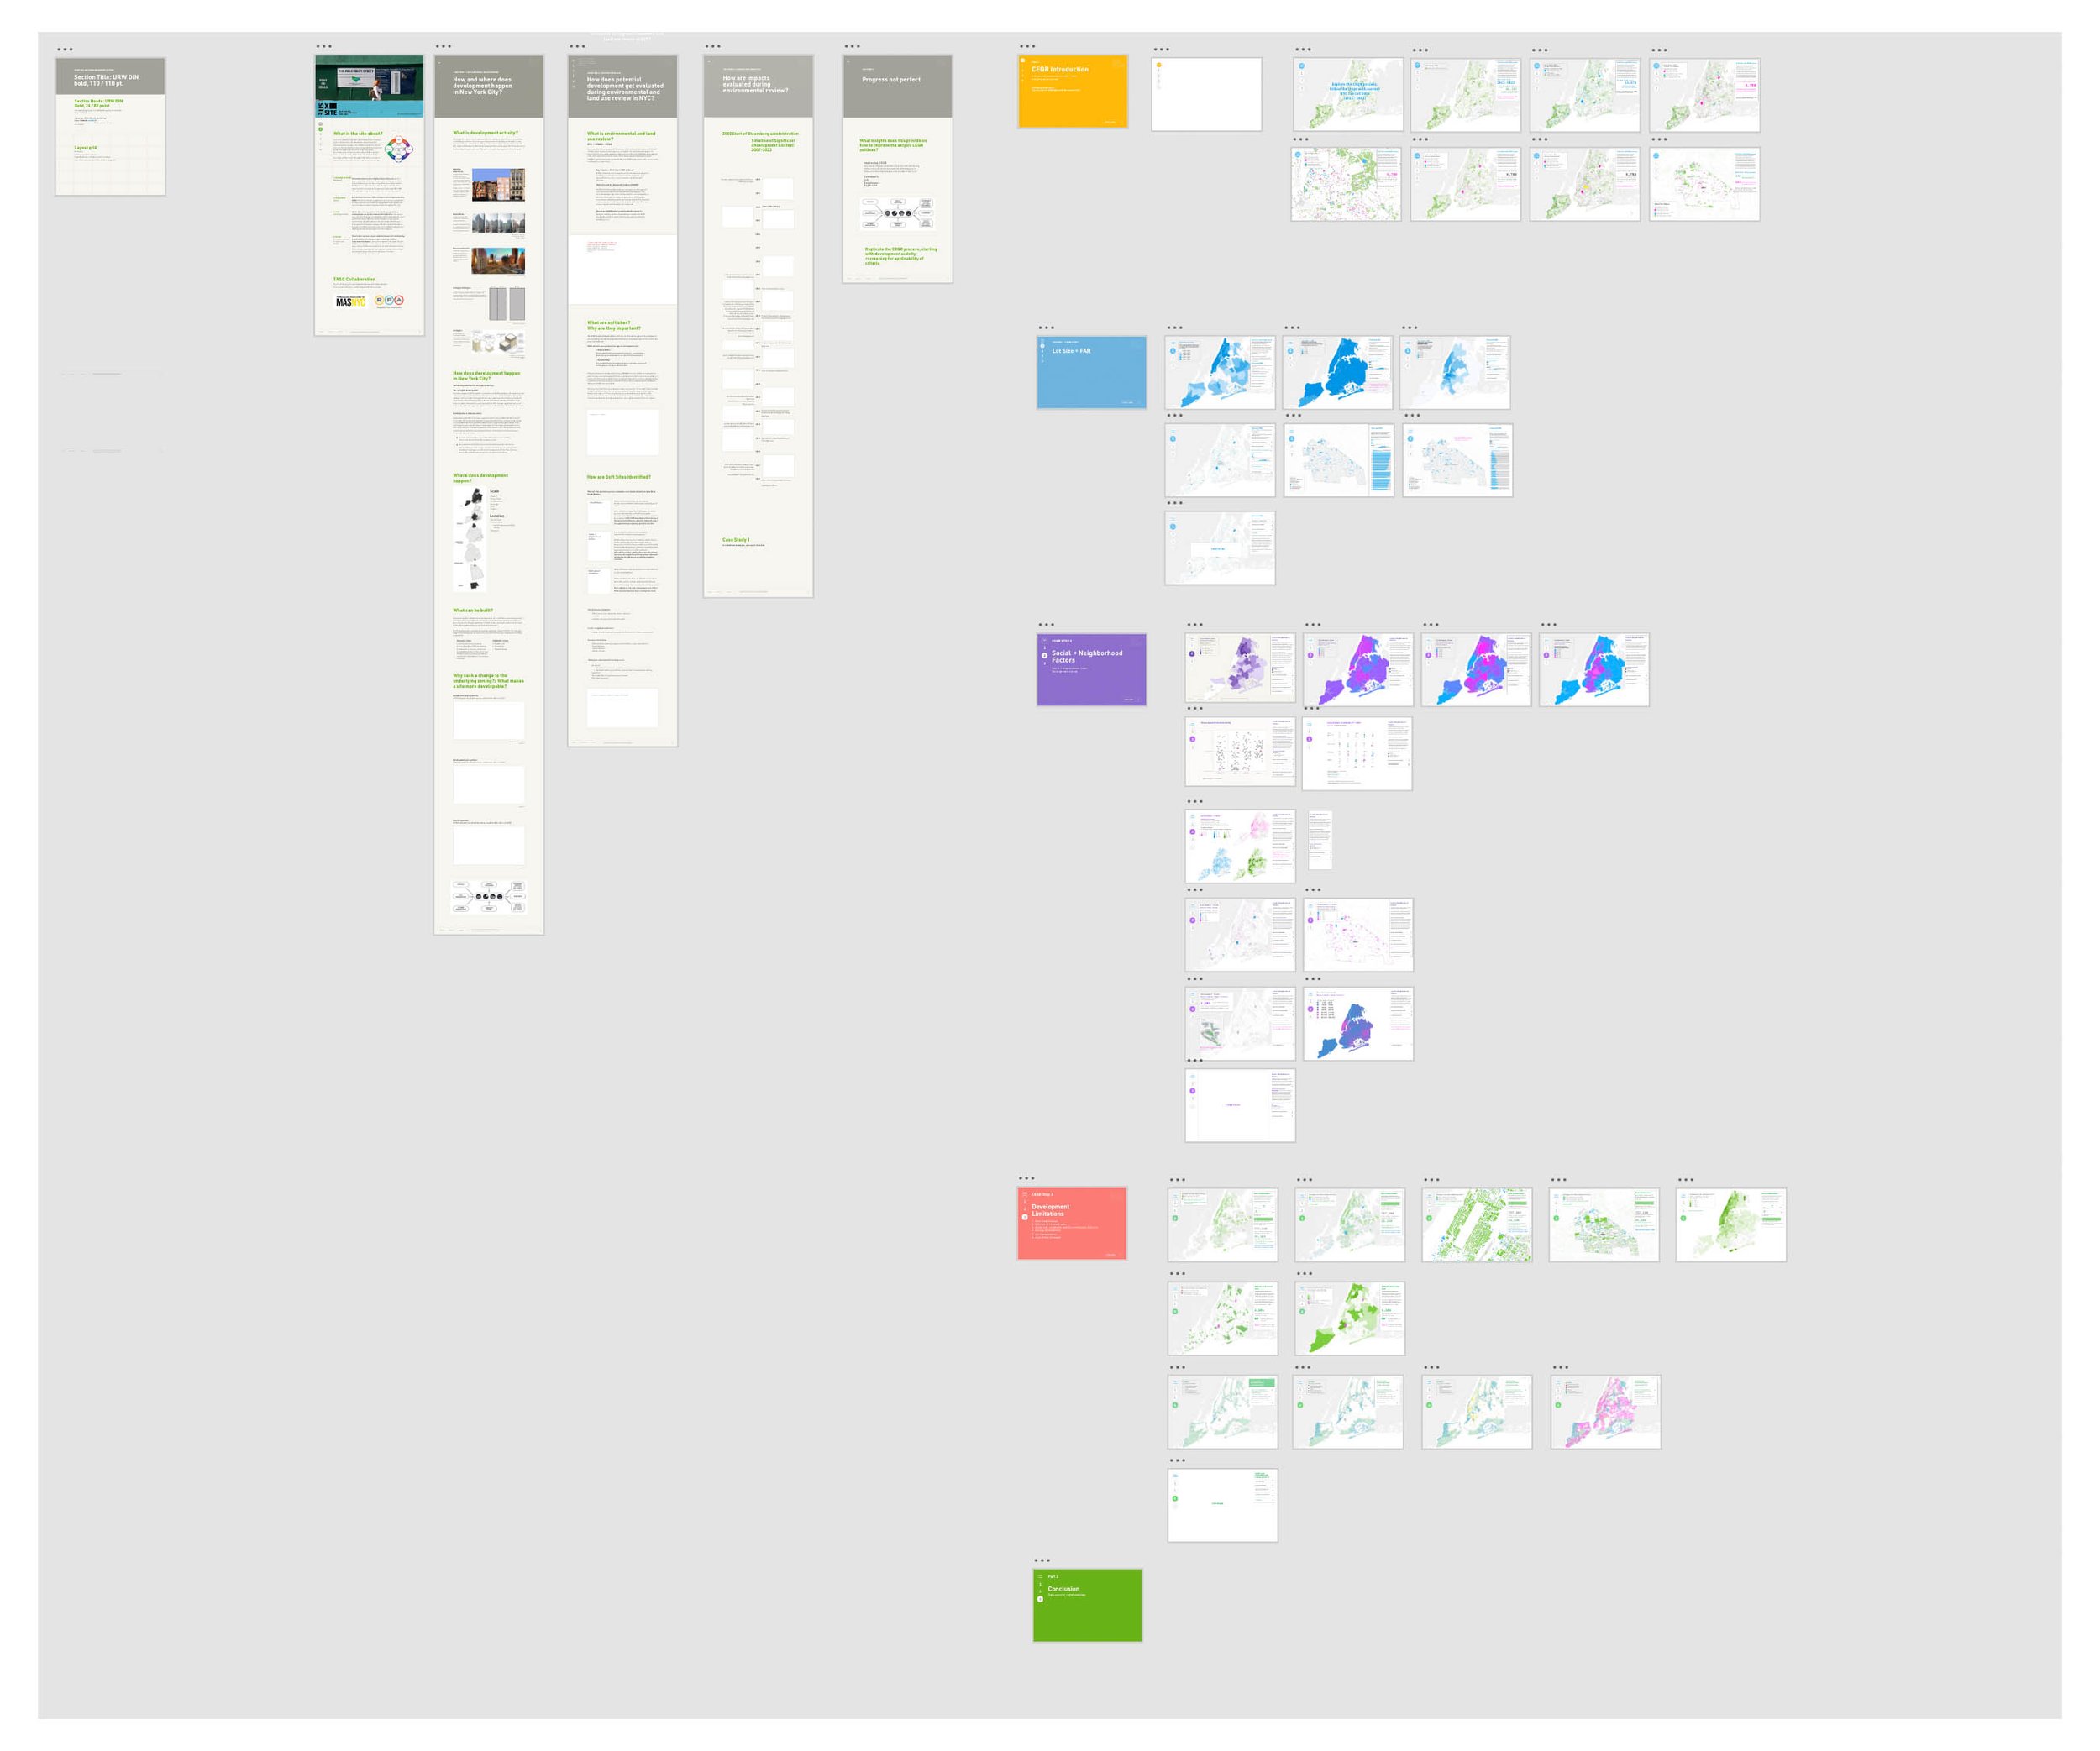
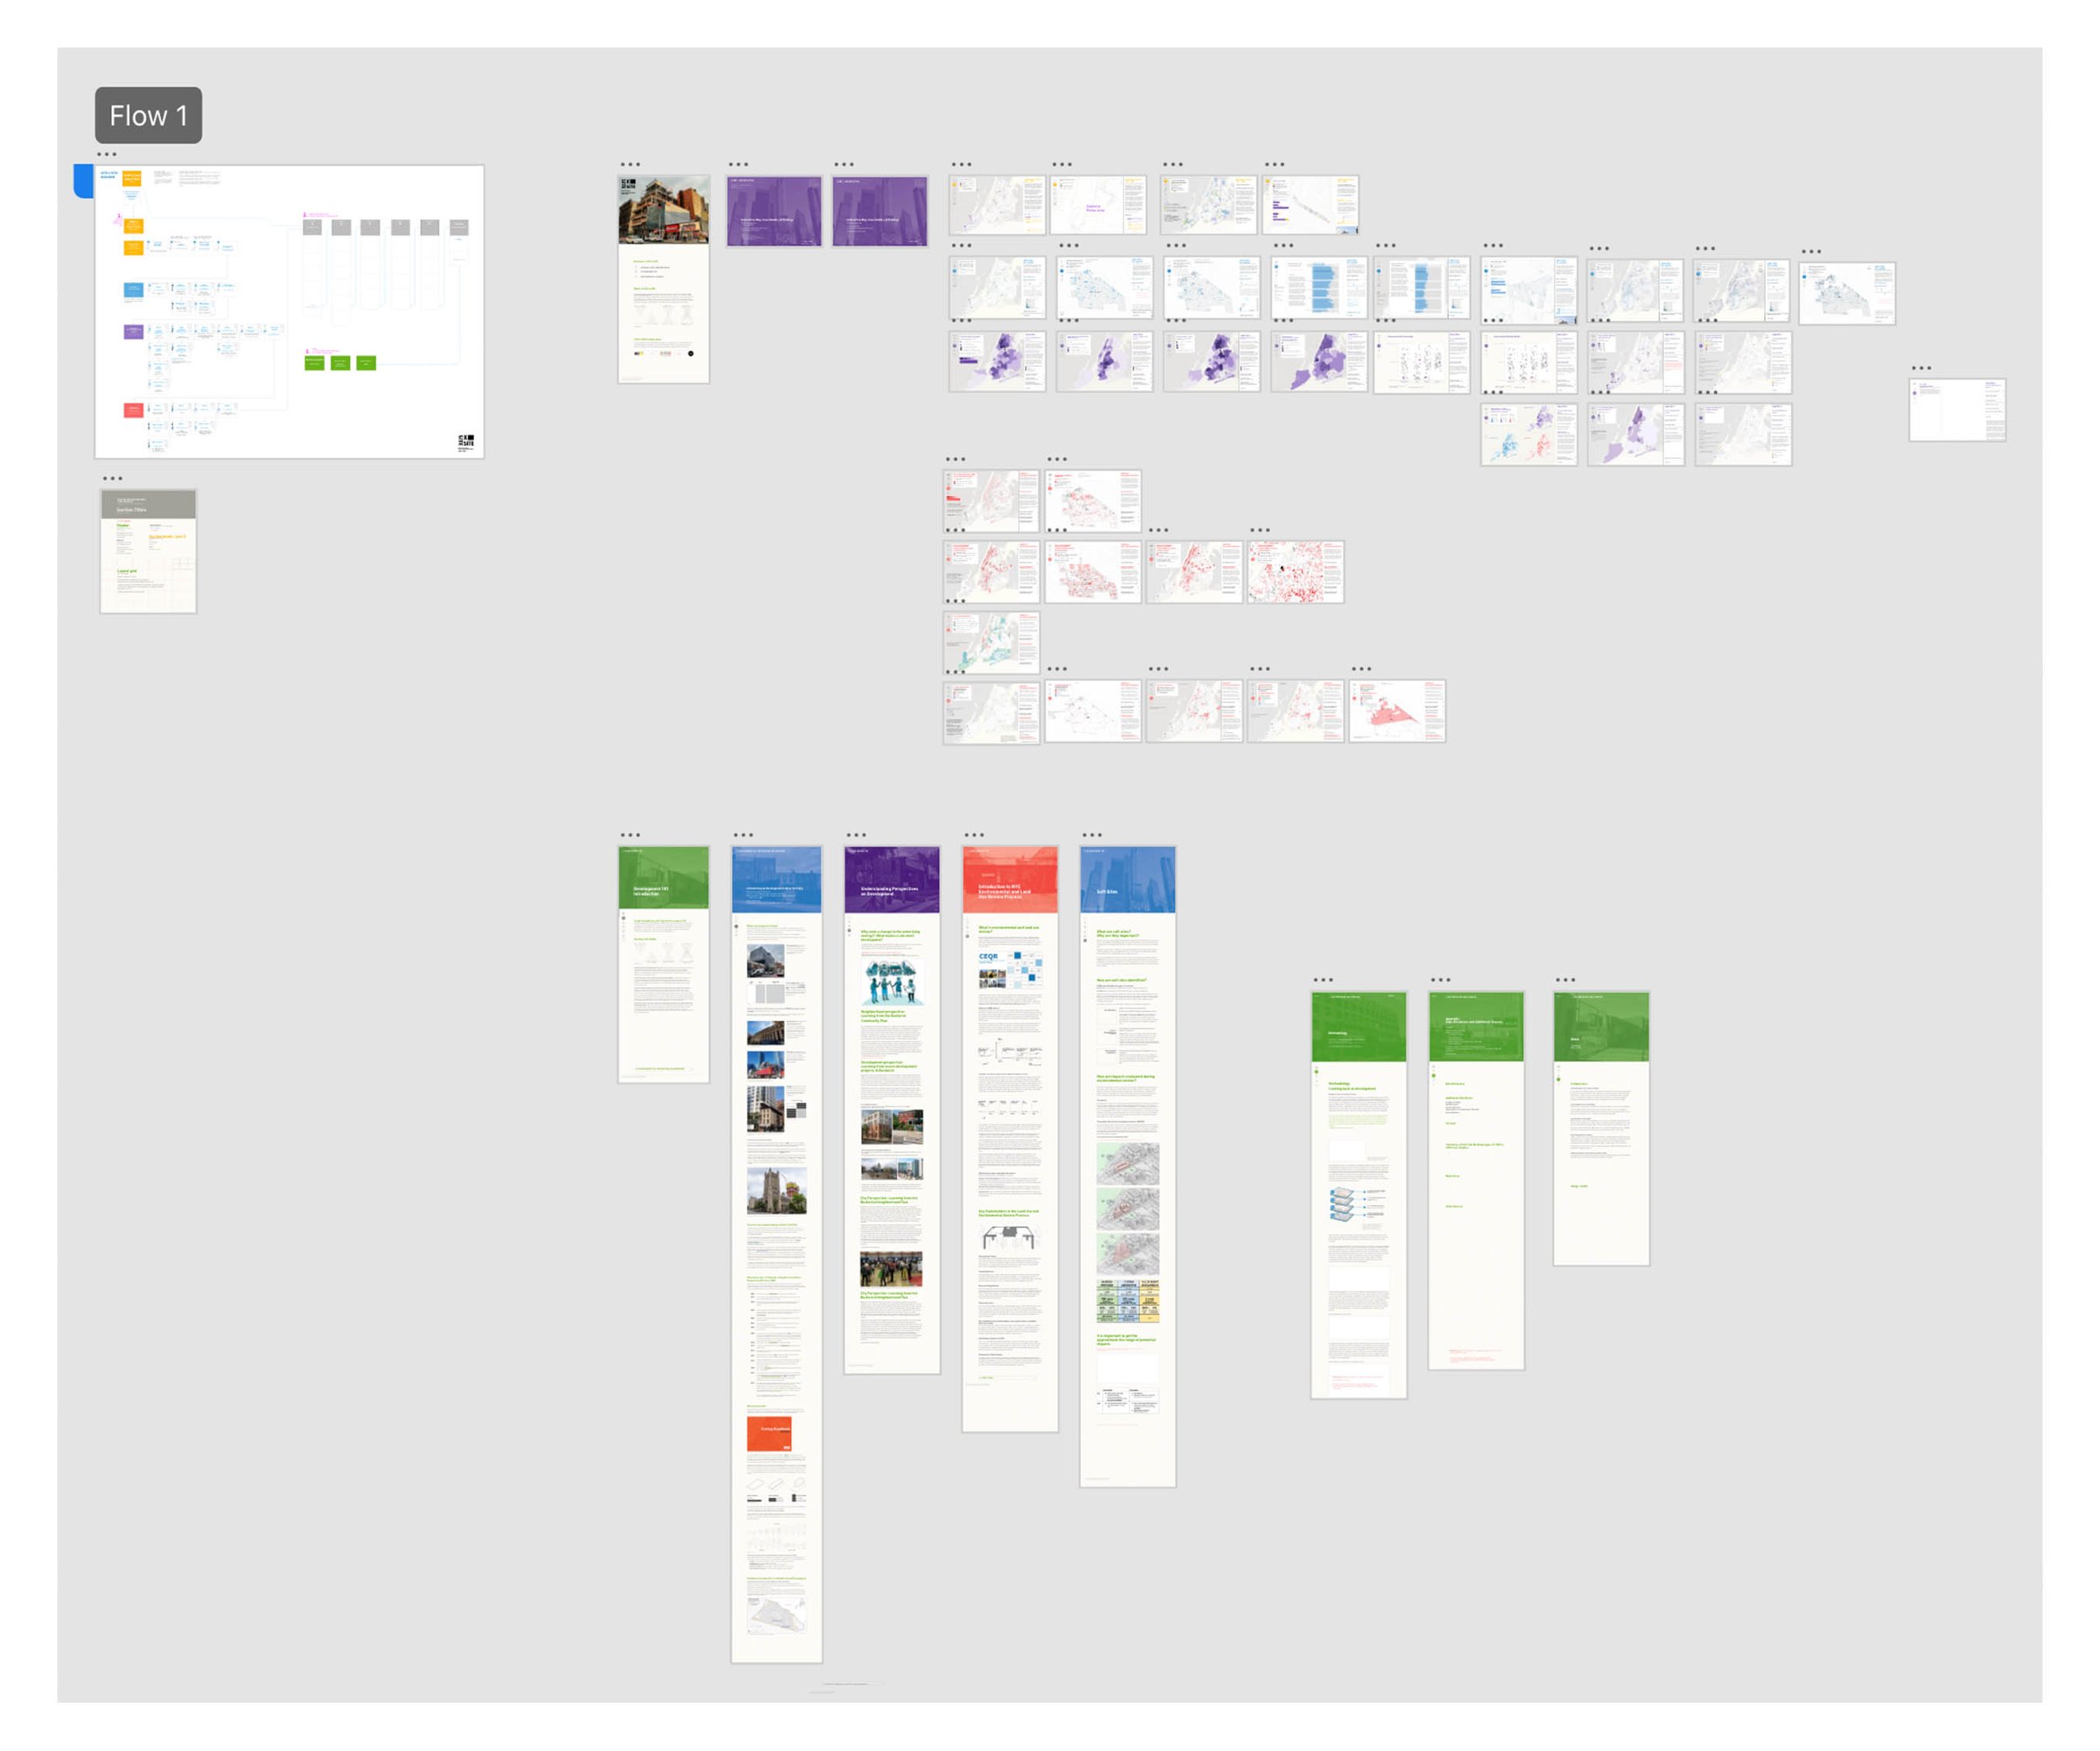
Transitioning from the months of retrospective analysis, the task of inventing a structure and website to present that analysis was next. Creating diagrams and content flow charts helped me to think through the user interaction and story-telling possibilities and served as useful guides to discuss those options with the team.
Many months were spent building the temporal data analysis with New York City Tax Lot data (PLUTO) and other data from the Census, the Department of Buildings, and the Department of Planning, but mostly with PLUTO. We compared characteristics between 2012 and 2022 to quantify and identify expected and unexpected change. Numerous indicators of soft sites and potential development were examined and re-examined from different angles through the data and with many python scripts.